Plastic Surgery KPIs: What to Actually Measure

Most plastic surgery practices measure marketing the way the agency wants them to: traffic, rankings, leads, and impressions. These are the metrics agencies have always been able to influence, the metrics that go up and to the right in monthly reports, and, not coincidentally, the metrics that are weakly correlated with the practice's actual P&L.
The KPIs that matter for a plastic surgery practice describe revenue and the path to it. They are harder to measure, more honest about what's working, and rarely show up in standard agency reporting. This piece names the ones that matter, defines them precisely, and walks through the attribution gaps that make standard analytics misleading.
This is also the piece that explains, in plain terms, why a practice can have rising rankings, rising traffic, more leads, and a flat surgical schedule, and why that's the failure mode no one wants to identify.
Key Takeaways
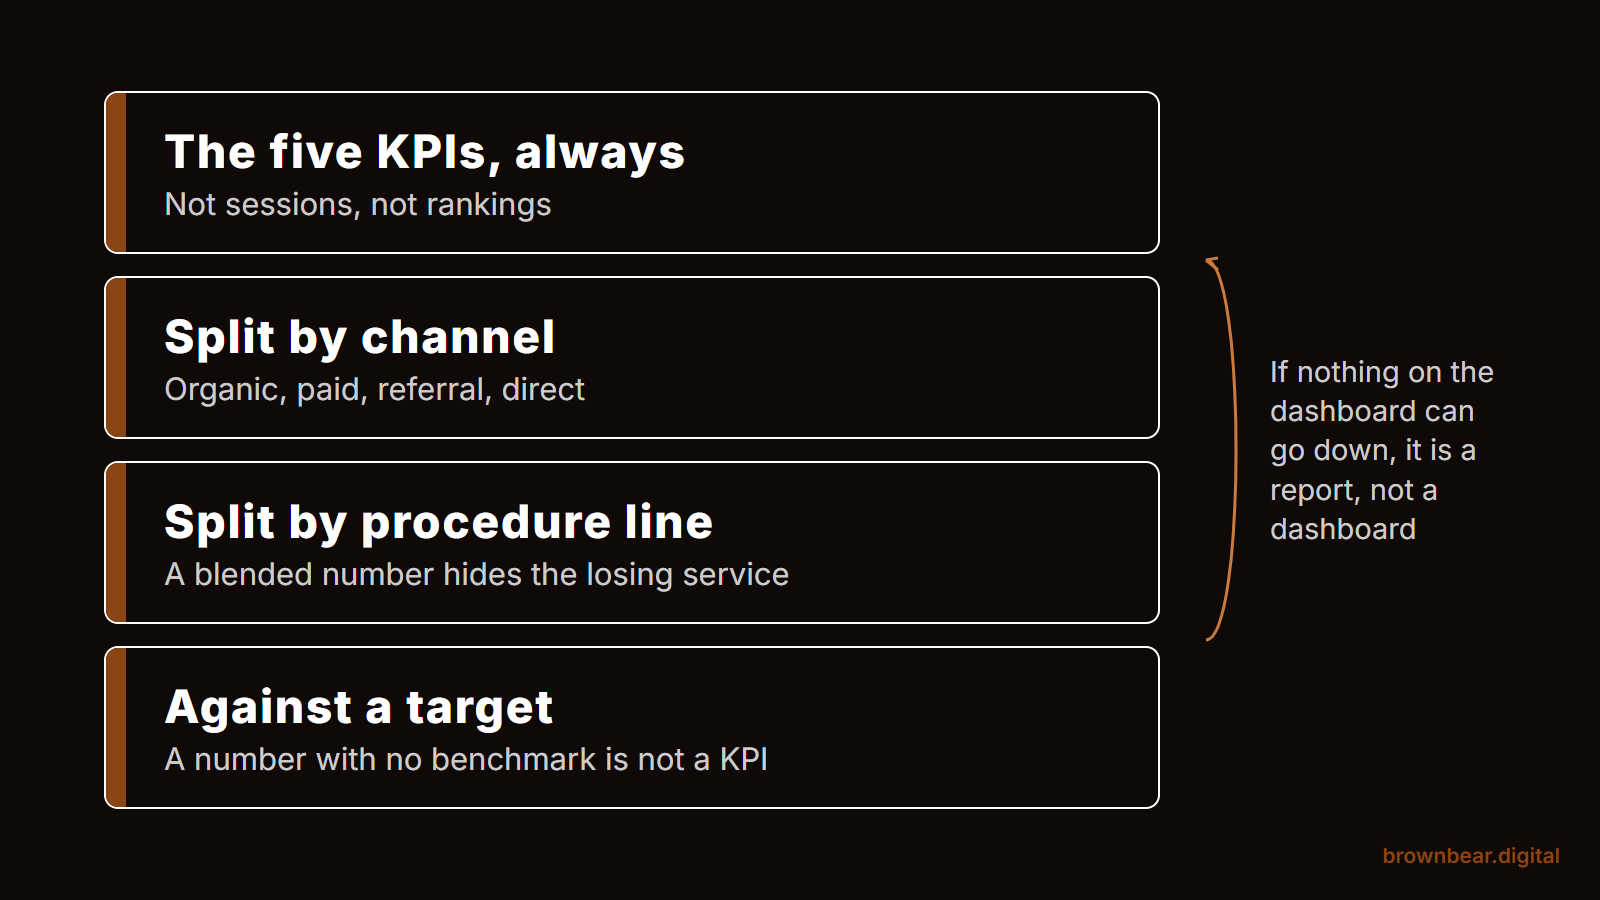
Measure the path to revenue, not agency activity
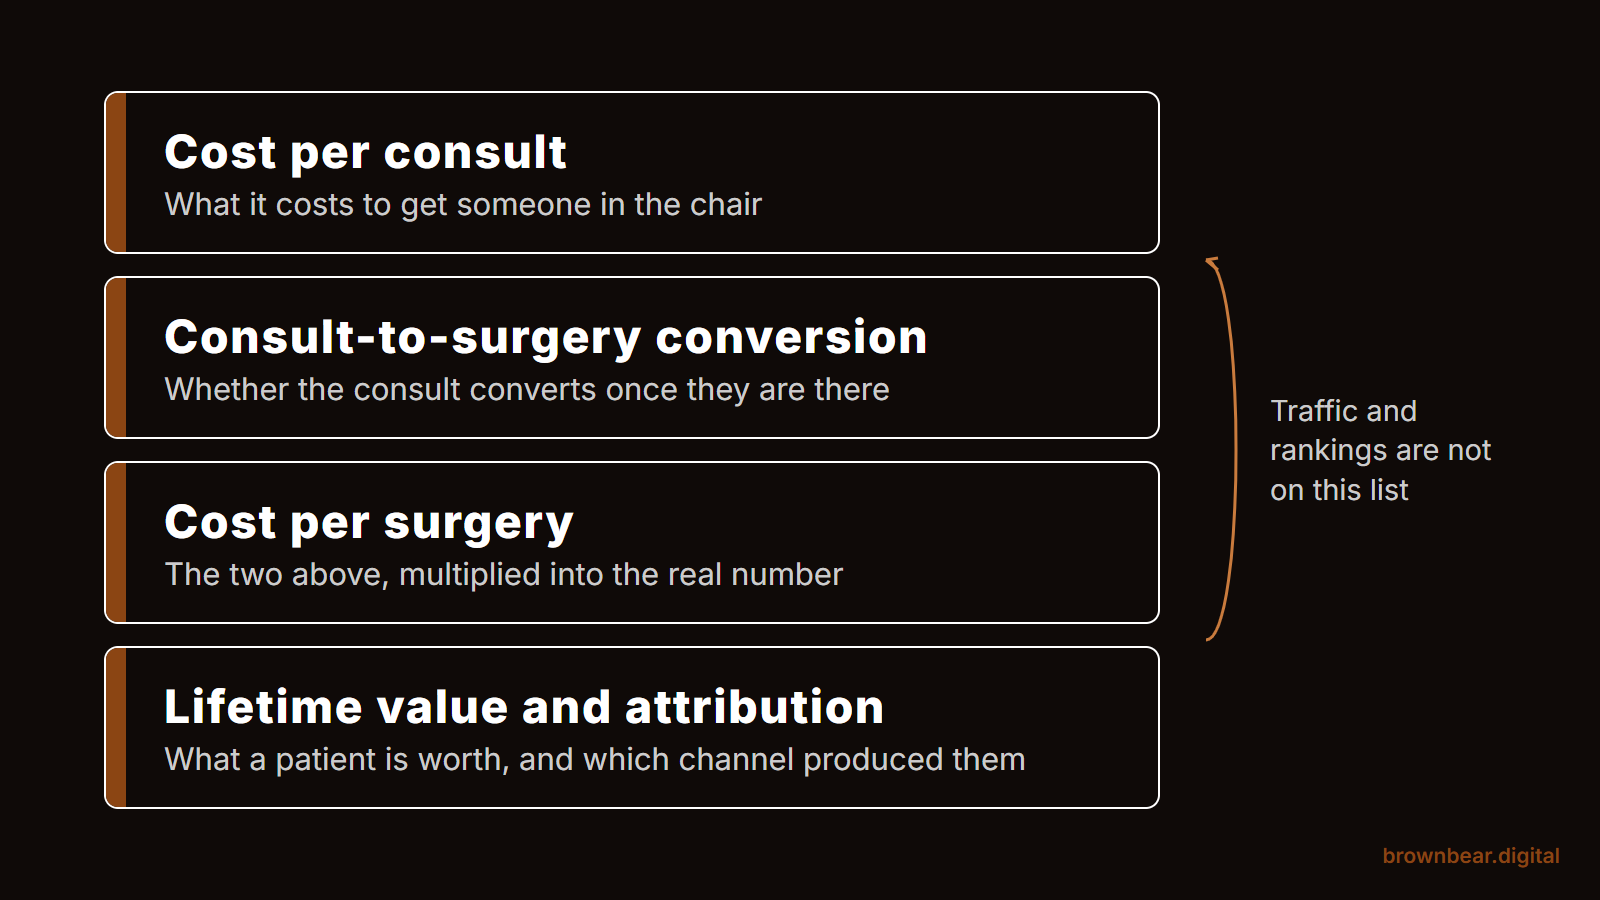
Traffic, rankings, and impressions are the metrics agencies can influence, and the ones weakly correlated with the P&L. Five KPIs actually describe performance: cost per consult, consult-to-surgery rate, cost per surgery, lifetime value, and source-of-consult attribution.
Cost per lead runs 30 to 60% below cost per consult
Lead counts include spam, under-18s, and price-shoppers who never call back. Cost per lead can trend down while cost per consult trends up, which means both look like improvement while the practice gets worse.
Two leak rates explain a rising cost per consult
Lead-to-booked and booked-to-attended sit between the form and the chair. When cost per consult climbs while cost per lead holds, the leak is in intake, not in the ads.
Consult-to-surgery rate is the most overlooked KPI
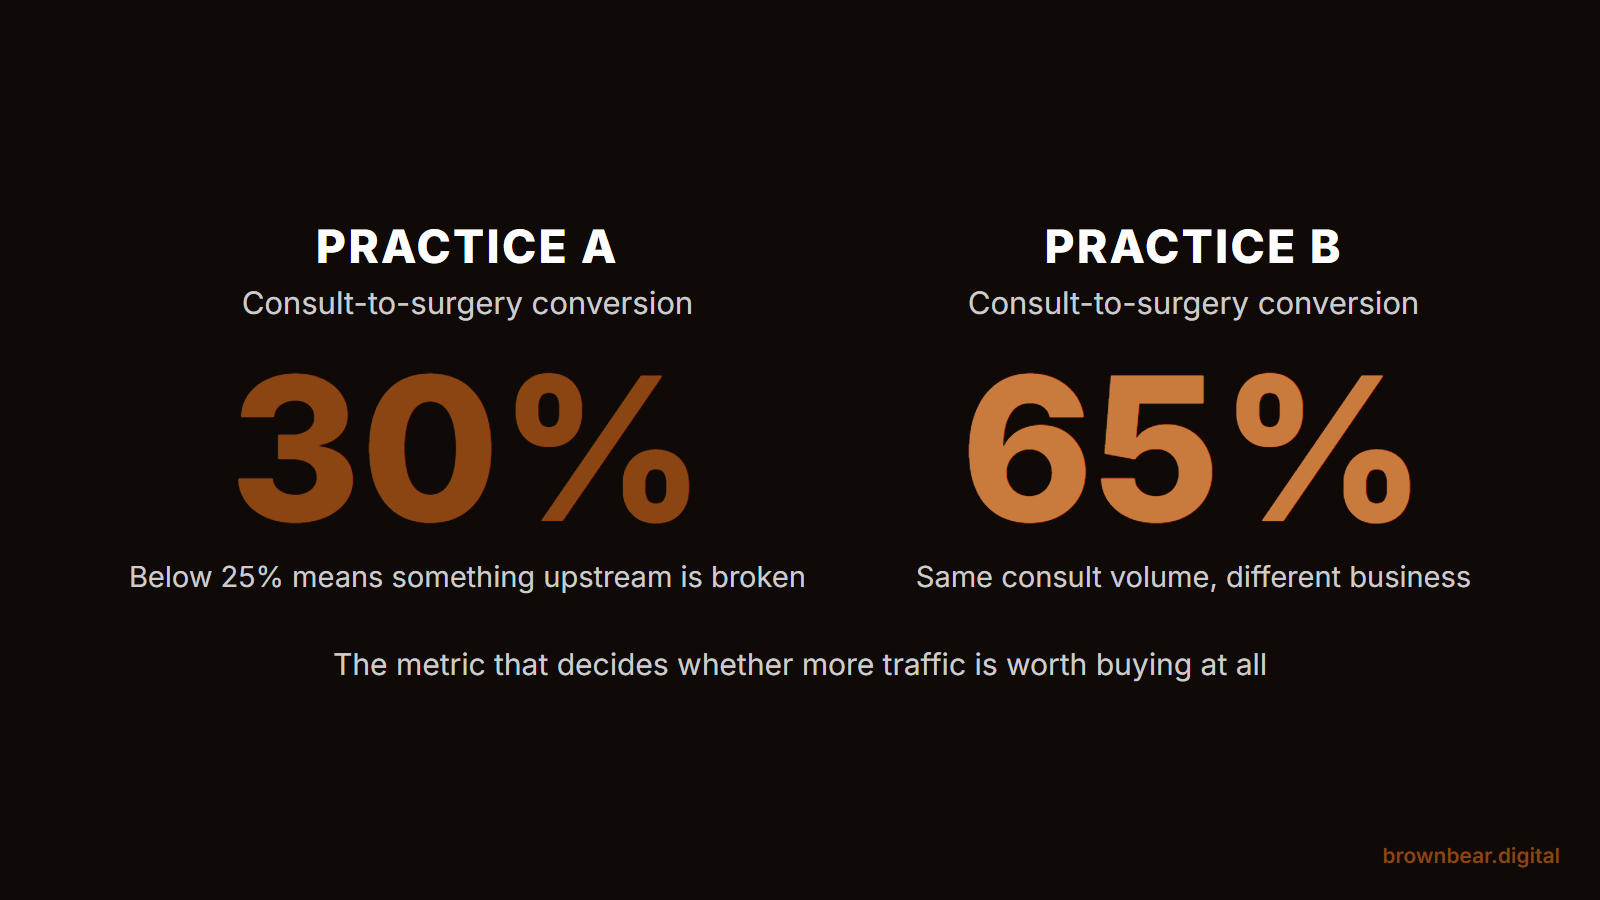
Two practices with identical cost per consult and consult volume can have radically different revenue because one converts at 30% and the other at 65%. Below 25% means something upstream is broken.
Ask patients at intake, not your analytics platform
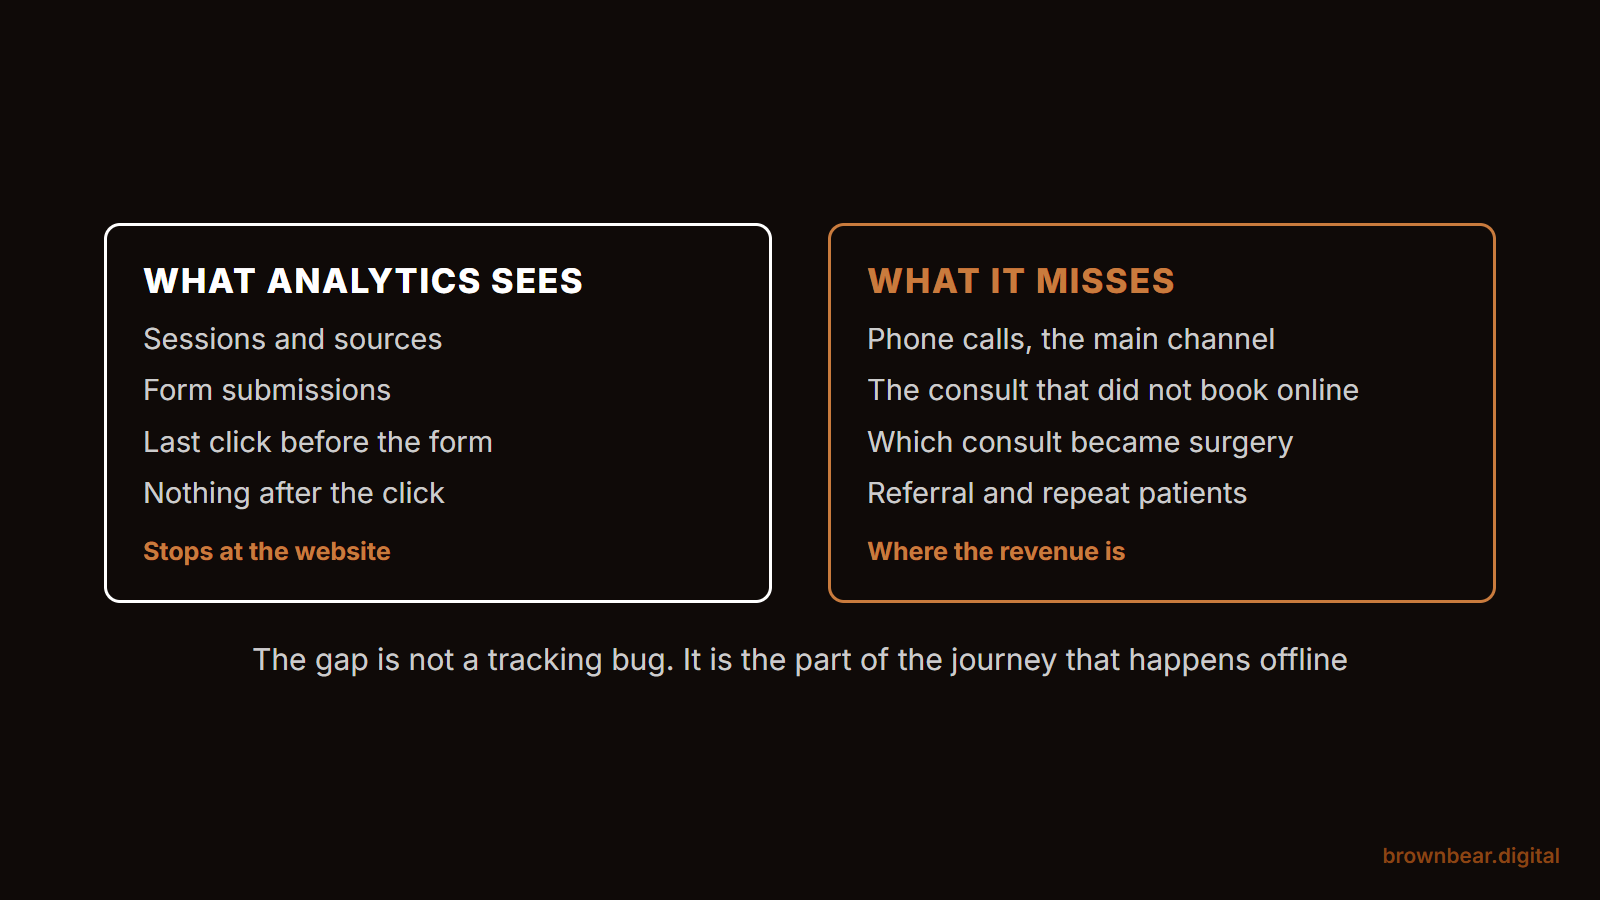
Last-click reports over-credit the final touch and bury the SEO that produced the demand, and no analytics model sees the phone call or the consult itself. Two intake questions, how you first heard about us and what made you book, beat any attribution model over six months.
The Five KPIs That Actually Describe Marketing Performance
1. Cost Per Consult
Definition:
Total marketing spend (paid media, agency fees, in-house marketing salaries allocated to acquisition) divided by booked, attended consultations in the same period.
Why it matters:
Form fills are not consults. Calls are not consults. Booked appointments are not consults. Only attended consults are consults, because the practice has spent staff time, surgeon time (often), and operational cost on each one.
Healthy ranges (rough, by metro and procedure mix):
- Lower-cost markets: $200 to $450 per attended consult
- Mid-cost markets (most U.S. metros): $400 to $800
- Highest-cost markets (major metros, competitive procedures): $700 to $1,500+
Common failure:
Practice tracks "cost per lead" instead, which is 30 to 60% lower because it counts everyone who filled a form, including the spam, the under-18s, the price-shoppers who never call back, and the wrong-procedure inquiries. Cost per lead trends downward while cost per consult trends upward. Both can be "improving" simultaneously while the practice is actually getting worse.
2. Consult-to-Surgery Conversion Rate
Definition:
Surgeries scheduled (or paid deposits, or surgeries completed, pick one and hold it) divided by attended consults.
Why it matters:
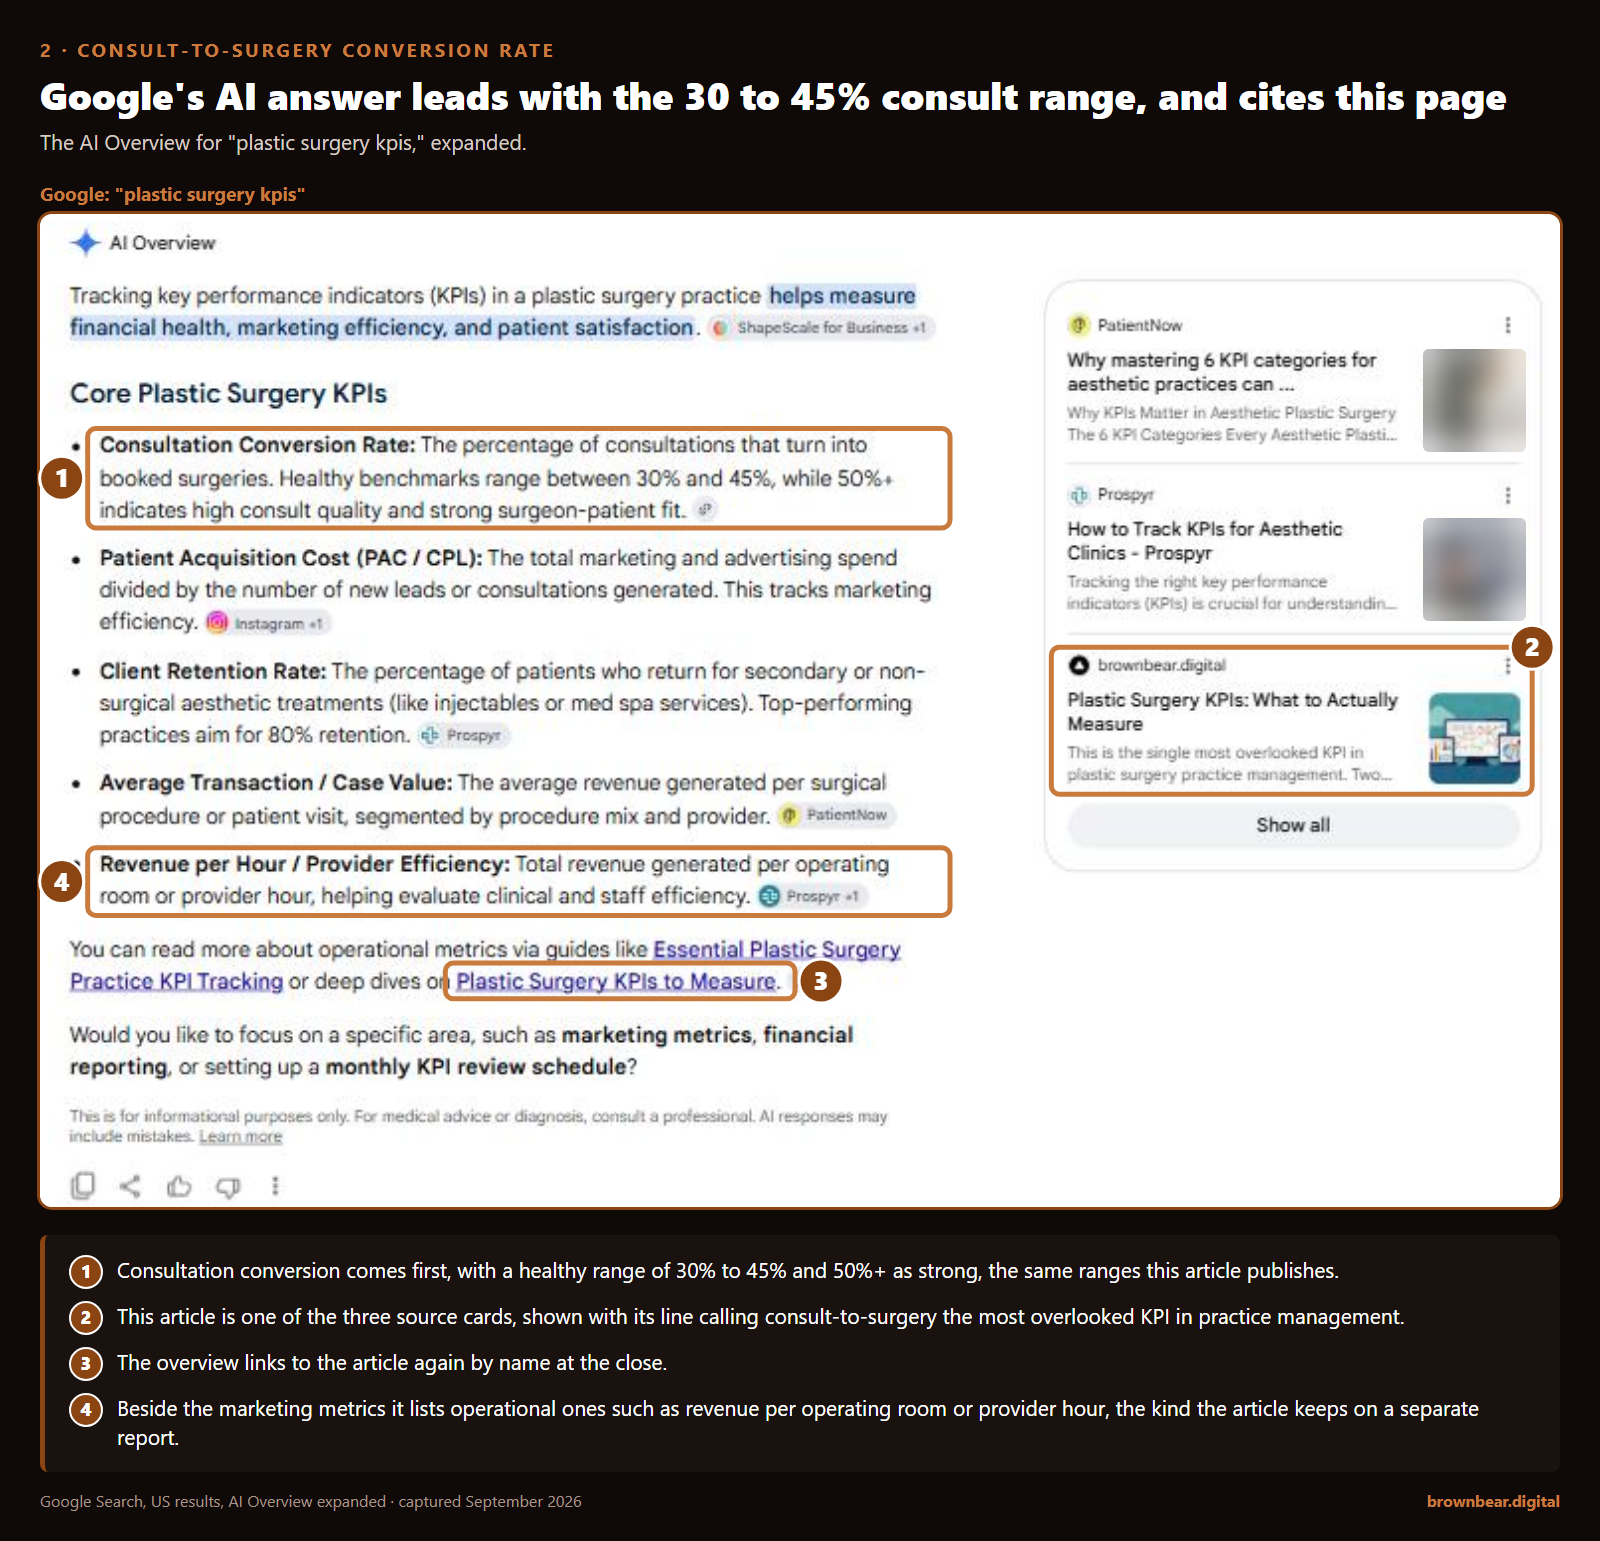
This is the single most overlooked KPI in plastic surgery practice management. Two practices with identical cost per consult and identical consult volume can have radically different revenue, because one converts consults at 30% and the other at 65%. It is also a named marketing metric in a 2026 review of plastic surgery practice marketing in Plastic and Reconstructive Surgery Global Open, listed alongside consultation booking rate and cost per acquisition, which is worth knowing the next time someone argues it sits outside marketing's lane.
Healthy ranges:
- Below 25%: something is wrong (consult quality, surgeon-patient dynamic, pricing, financing offers, or a marketing front-end pulling unqualified consults)
- 30 to 45%: typical
- 50%+: strong, often indicating excellent consult quality and good surgeon-patient fit
- 65%+: usually indicates either selective practice (solo surgeon, very high consult quality) or counting issues (the surgeries-scheduled denominator is incomplete)
Common failure:
Practice doesn't track this consistently because the EHR/CRM doesn't connect cleanly to the marketing data, so the surgeon never sees what's actually converting and what's wasting time.
3. Cost Per Surgery
Definition:
Total marketing spend in a period divided by surgeries scheduled (or completed) in the same period, with appropriate lag adjustment for the consult-to-surgery time window.
Why it matters:
This is the metric that directly compares to procedure revenue. If a rhinoplasty practice has a $14,000 average ticket and a $1,800 cost per surgery, the marketing is producing strong unit economics. If the cost per surgery is $4,500, the unit economics are marginal.
Healthy ranges (by procedure category):
- Lower-ticket procedures (botox, fillers, laser): $50 to $250 per procedure
- Mid-ticket surgical (breast aug, mommy makeover, smaller cases): $1,200 to $3,000
- High-ticket surgical (rhinoplasty, facelift, full mommy makeovers): $1,500 to $4,500
How the lag adjustment works:
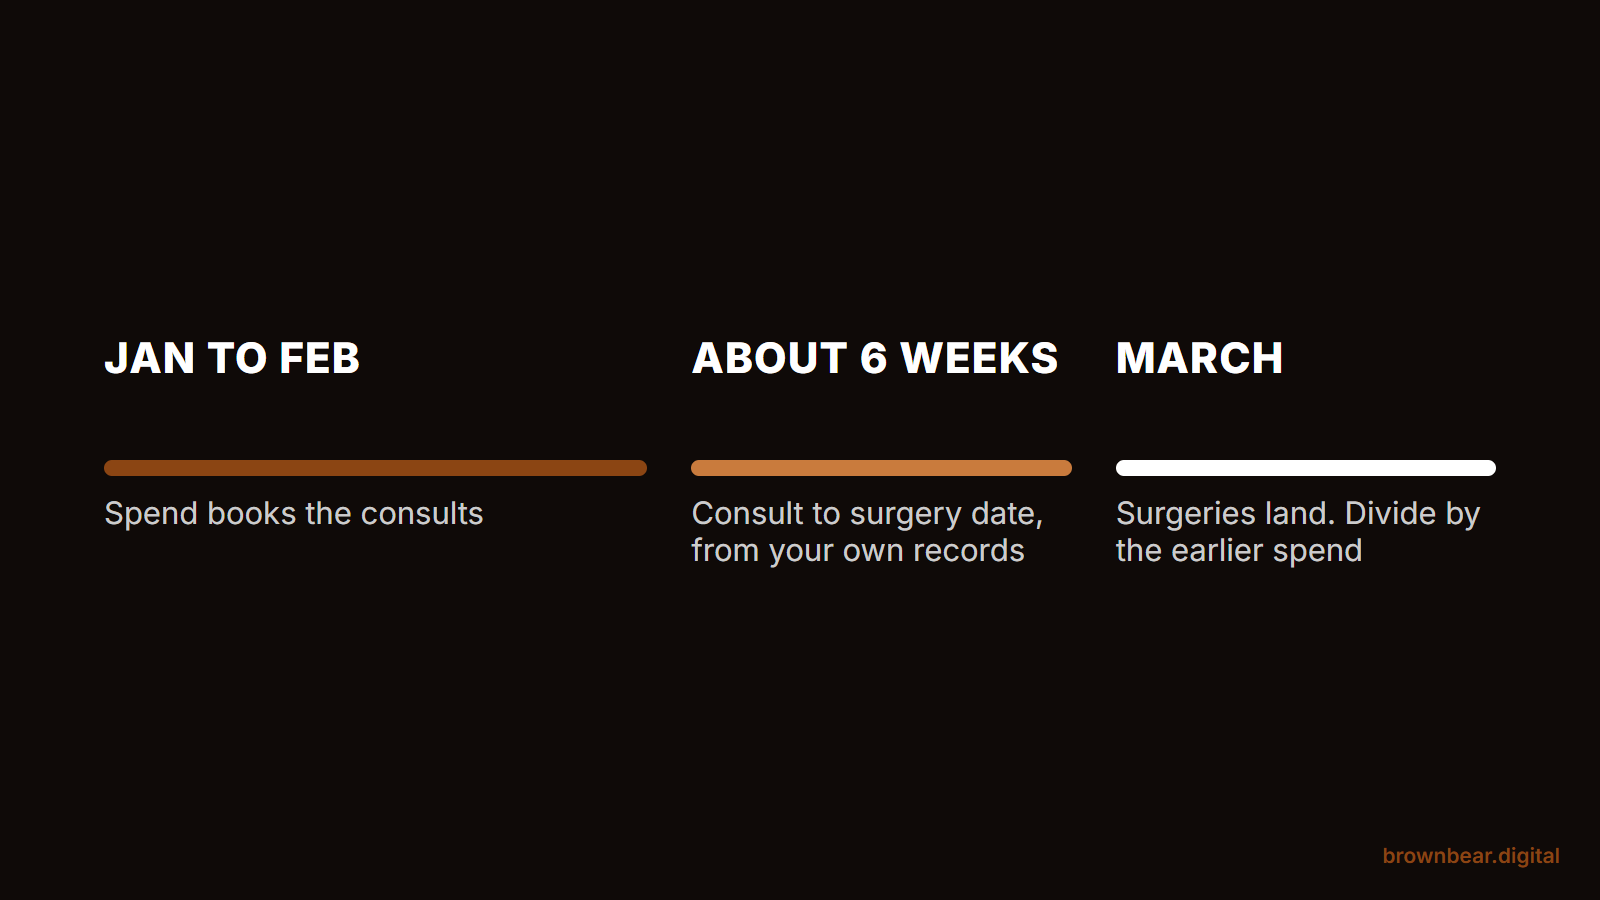
Say a practice spends $30,000 on marketing in March and schedules 12 surgeries that month. Dividing one by the other gives $2,500 per surgery, but most of those 12 patients consulted in January or February, on earlier months' spend. If the practice's own records show consult to surgery date running about six weeks, the fair comparison is March surgeries against the spend from roughly mid-January to mid-February. Pick the window from your own data, apply it every month, and the number stops swinging with the calendar.
If you have seen a benchmark under $100:
blended cost-per-acquisition figures in that range circulate online, and they mix injectable and laser bookings with surgery. If most of your volume is non-surgical, a blended number is a fair yardstick for that line. If surgery drives your revenue, report cost per surgery separately from cost per non-surgical procedure, because an average that includes hundreds of injectable appointments says nothing about what a facelift patient costs to acquire.
Common failure:
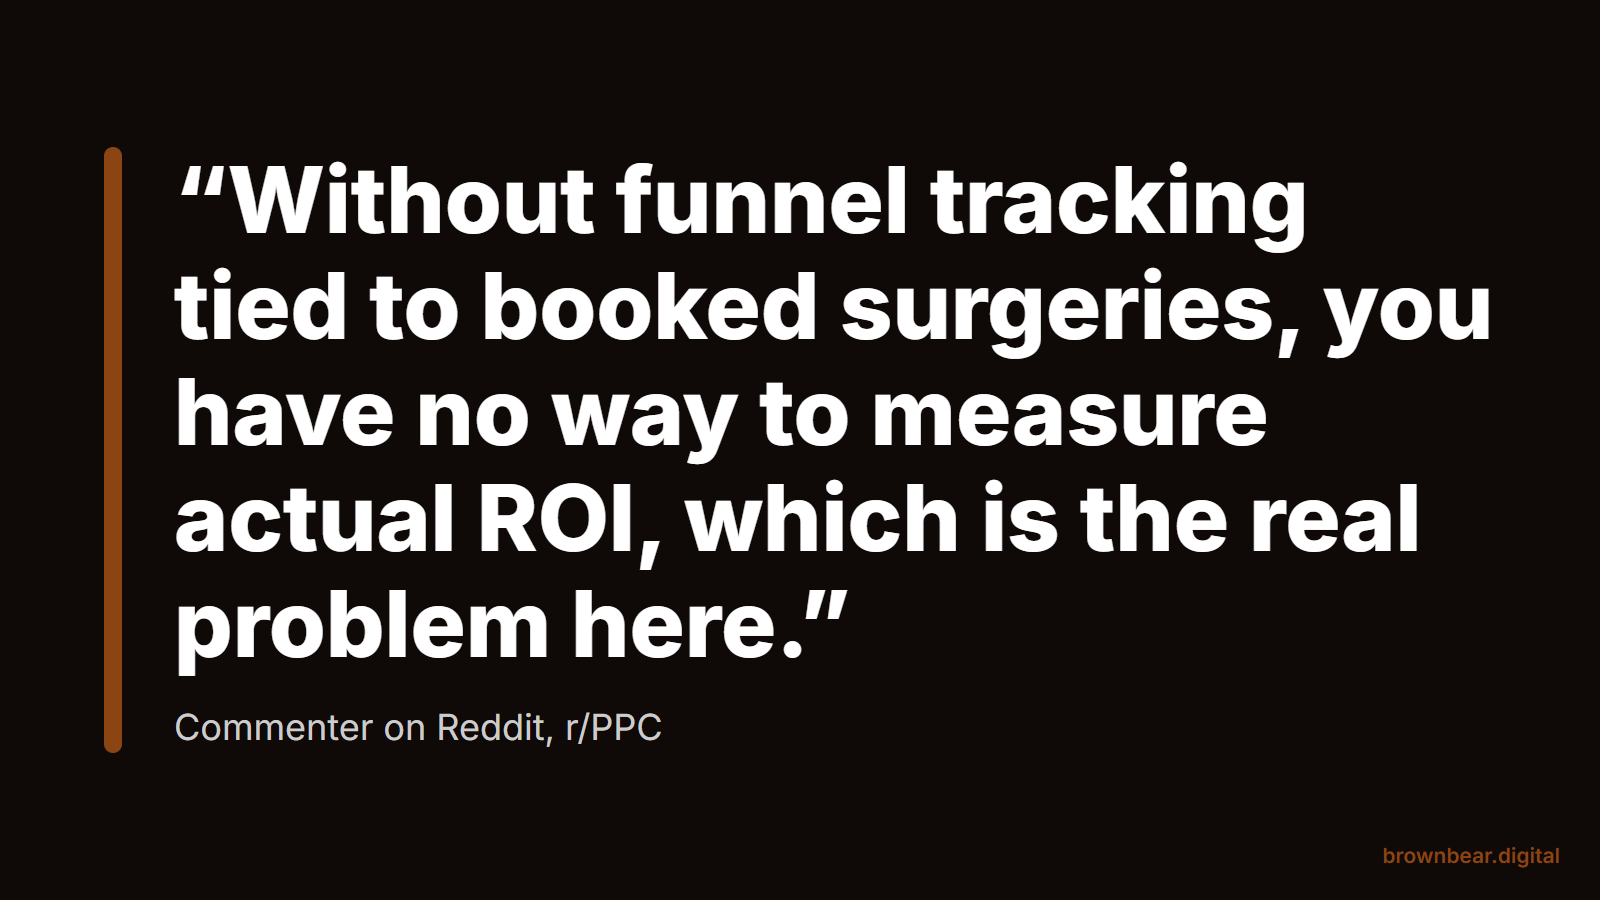
Not measured at all. Practice has cost per consult and traffic numbers but never closes the loop to surgery, so the actual ROI of marketing is invisible.
4. Lifetime Value Per Patient
Definition:
Total revenue from a patient over the relationship: initial procedure plus subsequent surgical, non-surgical, skincare, retail. For modeling purposes, typically computed at the cohort level (LTV at 1 year, 3 years, 5 years).
Why it matters:
Plastic surgery has unusual LTV economics. A patient who comes in for breast augmentation often returns for non-surgical maintenance (botox, fillers) for years, may return for a second procedure (lift, revision, mommy makeover), and refers other patients. LTV is often 1.5x to 3x the initial procedure ticket.
Why this matters for KPIs specifically:
A practice that knows its LTV can spend more on initial acquisition than a practice that doesn't, and can choose to. The acquisition cost that looks unsustainable on first-procedure economics looks healthy on three-year LTV economics. Practices that don't measure LTV consistently underspend on acquisition, which feels conservative and is actually the slower-growth path.
Common failure:
Practice tracks first-procedure revenue and stops there. The cross-procedural and longitudinal revenue is invisible, and acquisition decisions are made on bad data.
The leading indicator:
three-year LTV takes three years to read, so watch the rebooking rate in the meantime: the share of surgical patients who come back for a first non-surgical or skincare visit within twelve months. If that rate is falling, the LTV you are budgeting acquisition against will not arrive, and it is better to learn that in year one than in year three.
5. Source-of-Consult Attribution
Definition:
For each attended consult, the marketing source that produced it: organic search, paid search, paid social, referral, returning patient, walk-in, etc. Captured at the consult itself, not inferred from analytics.
Why it matters:
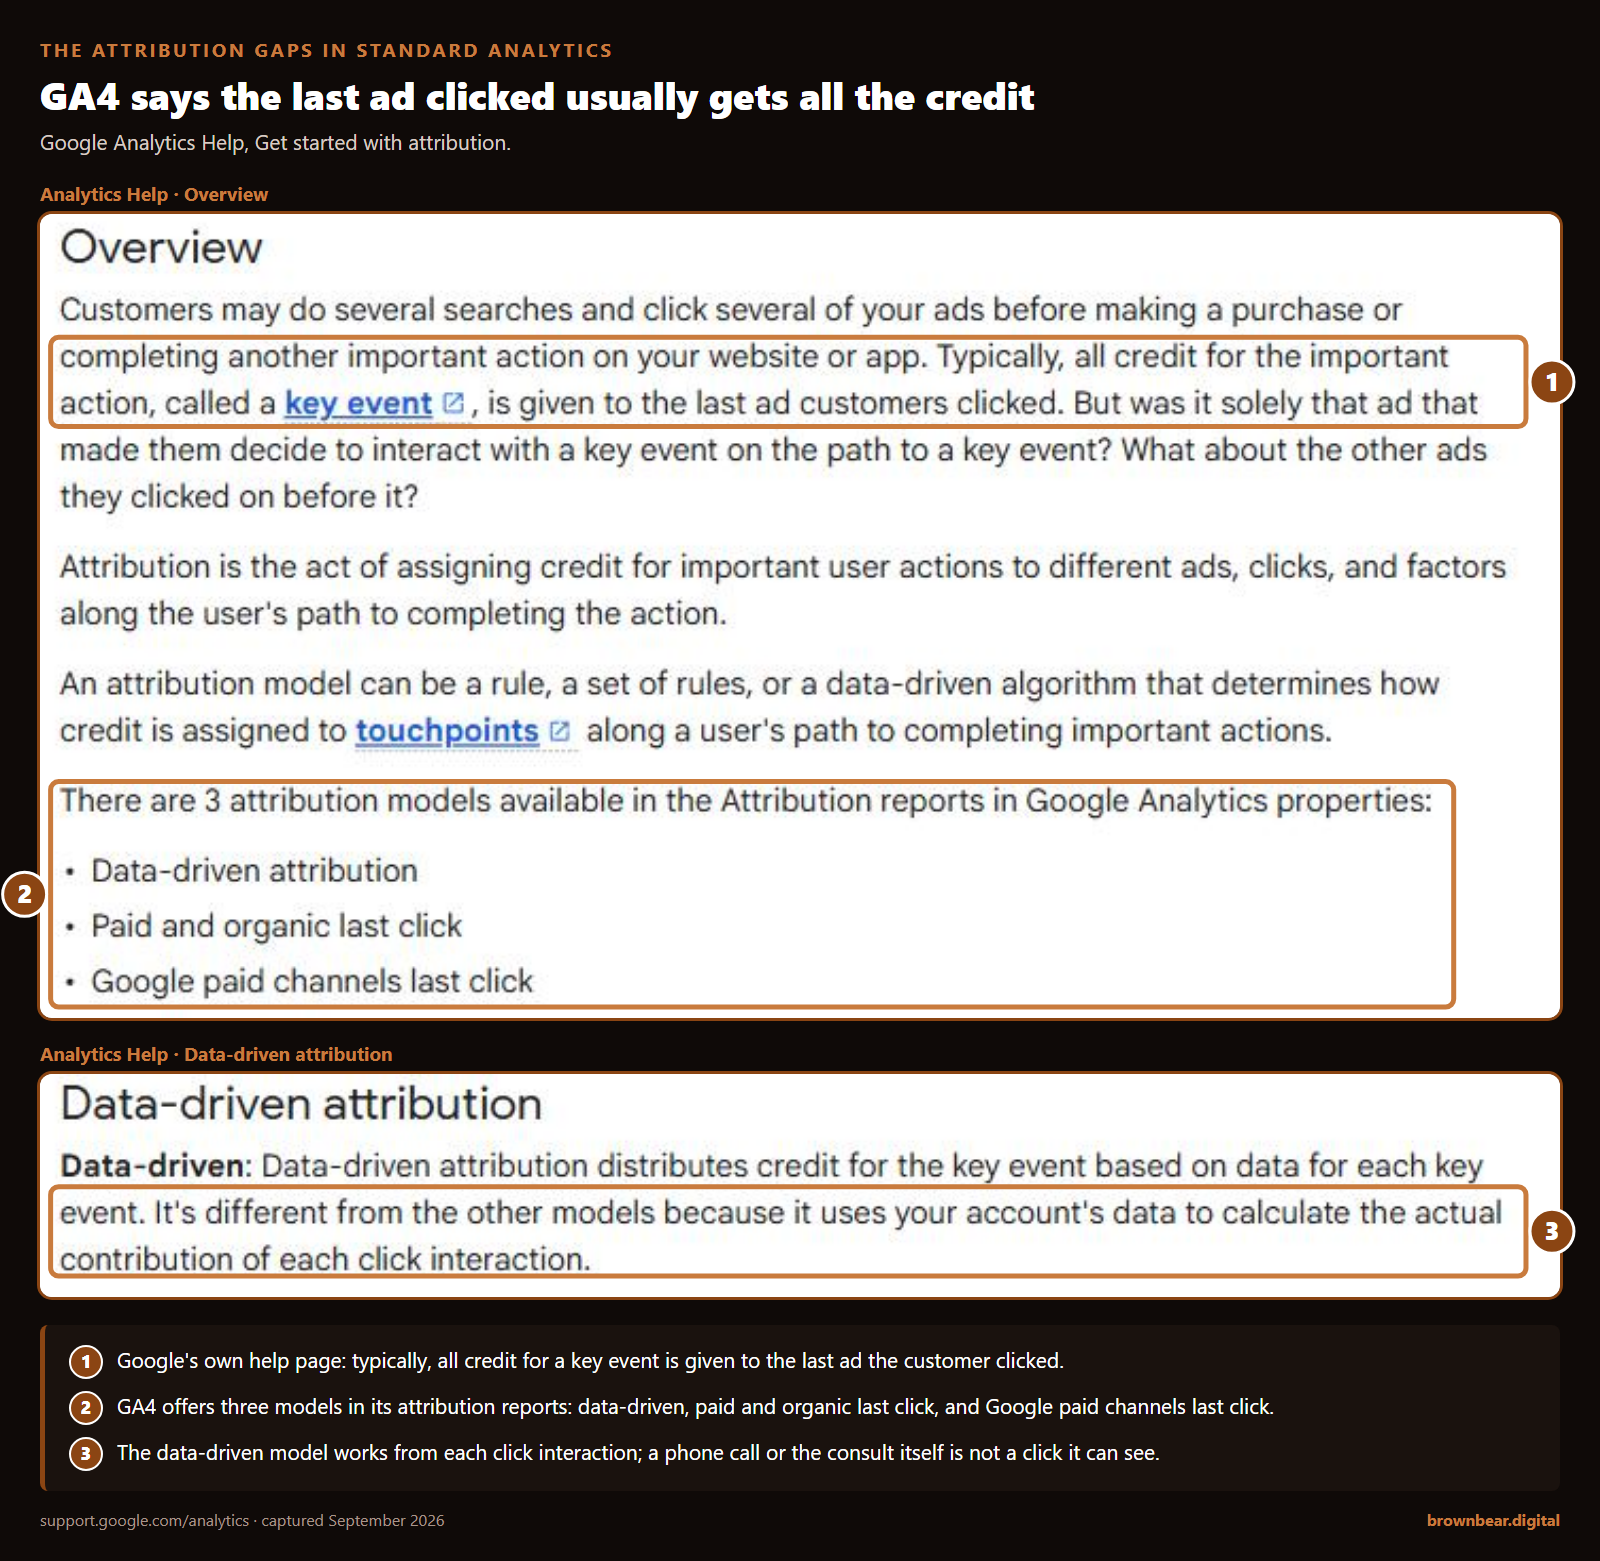
Standard analytics platforms (GA4, paid platform reporting) tend to over-credit the last click and under-credit research-stage sources like SEO and content. A patient who reads three SEO articles, then sees a paid ad, then books a consult shows up as a paid search conversion in any last-click report. GA4's data-driven model spreads some credit back, but only across sessions it can tie to the same visitor, and it never sees the phone call or the consult itself. That is the wrong attribution, and it leads to the wrong investment decisions.
The method that works:
Ask the patient at consult intake. "How did you first hear about us?" and "What finally made you book?" are captured by the front desk and routed into the CRM. This data, aggregated over six months, is more accurate than any analytics platform's attribution model.
Give AI assistants their own line.
Add "an AI assistant like ChatGPT" as an answer option on that intake question, and split ChatGPT, Perplexity, Gemini, and Copilot referrals into their own analytics segment instead of leaving them inside "referral" or "other." Across our client analytics, visitors referred by AI assistants convert to consultations at a higher rate than our other channels, which is why they get their own line in the reporting for our AI assistant visibility work. The volume is still small; the intent is not. Our guide to AI mention and referral tracking walks through building the segment.
Common failure:
Attribution lives in the marketing platforms, where SEO is invisible (because it produced the brand search that paid then captured), and the practice underspends on the channels that are actually producing.
Where Leads Leak Before They Become Consults
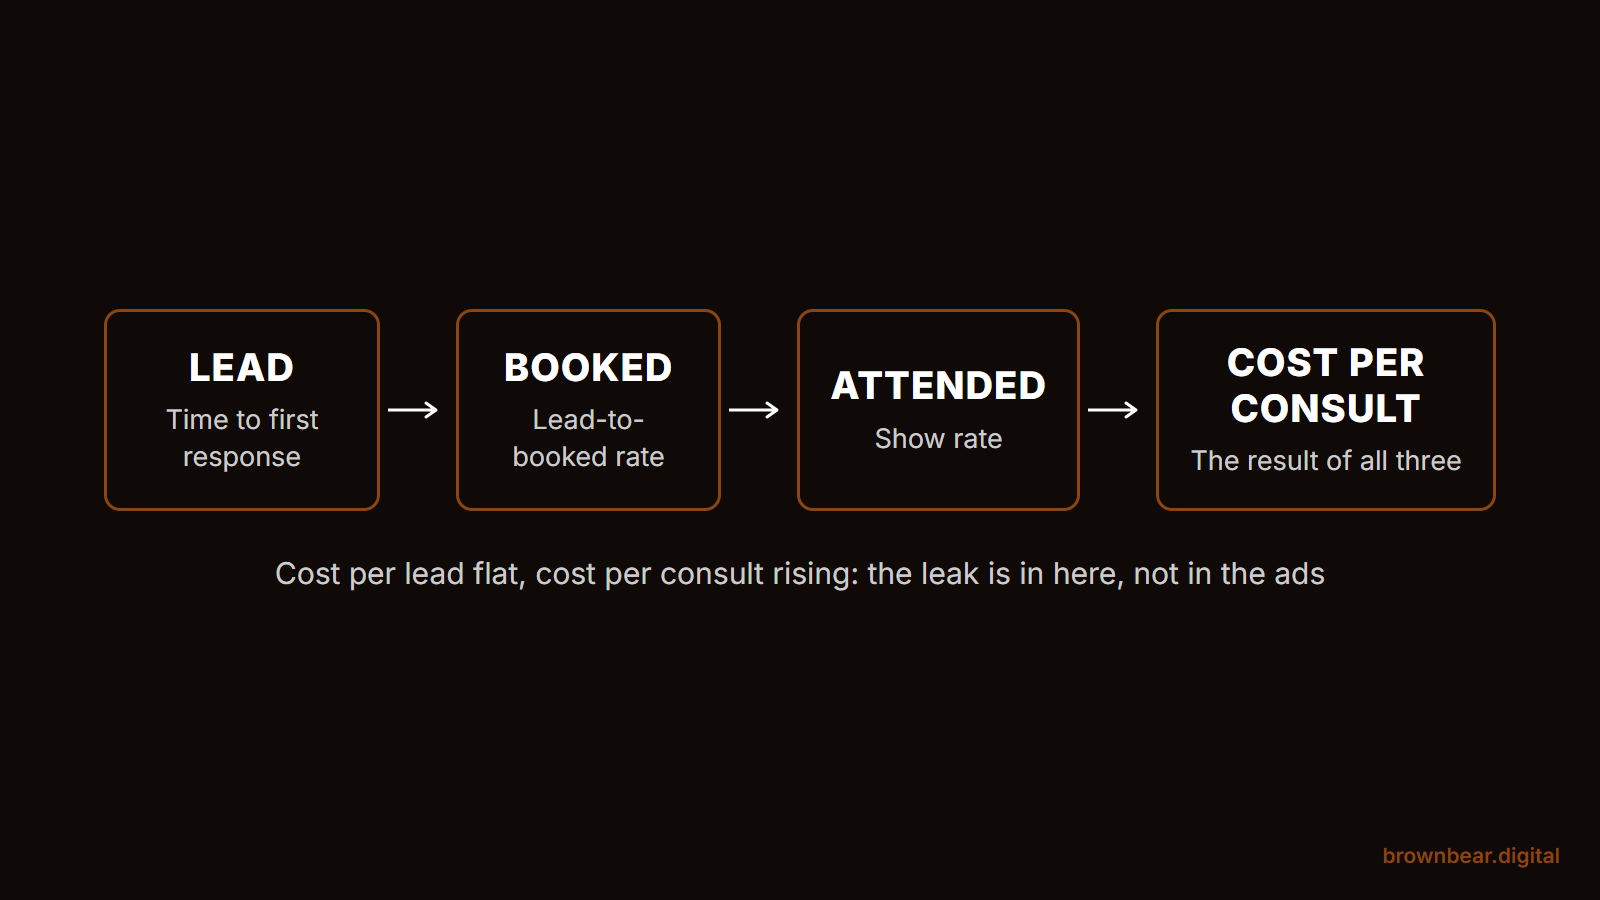
Cost per consult is set by three things that happen between the form fill and the chair: how fast the practice responds, how many leads book, and how many booked consults actually show up. When cost per consult rises while cost per lead holds steady, the ads are rarely the problem. The leak sits in one of these three places, and each has its own rate.
- Lead-to-booked rate: consults booked divided by qualified leads in the same period. Qualified means a real person, of age, asking about a procedure the practice performs.
- Show rate: consults attended divided by consults booked. Cancellations, reschedules that never happen, and no-shows all live here.
- Time to first response: minutes from a form submission or missed call to a human reply, measured separately for office hours and after hours, because the two are rarely the same.
If you own the practice and read the agency report each month, ask for these three by name. If you are the practice manager who runs the front desk, this part of the chain is yours more than the agency's, and the Leak Map below shows where to look first.
The Leak Map
Read across from the KPI that moved. The column that held steady tells you where the leak is not.
| What moved | What held steady | Where the leak is | First fix |
|---|---|---|---|
| Cost per consult up | Cost per lead | Intake: lead-to-booked or show rate | Time the first reply on your last 20 leads, including evenings and weekends |
| Cost per lead up | Lead-to-booked rate | Media: targeting, bids, or search terms | Audit search terms and audiences before touching intake |
| Show rate down | Consults booked | The gap between booking and the visit | Check how many days out consults are booked, confirmation calls, and whether a deposit holds the slot |
| Consult-to-surgery down | Cost per consult | Consult quality or the consult itself | Sort non-converting consults by source to see which campaign sent them |
| Surgeries flat | Consults and consult-to-surgery | Capacity, not marketing | See the operational KPIs section below |
Picture a two-surgeon practice whose cost per lead has held near $150 for a year while cost per consult drifts from $450 to $700. The agency blames rising click costs, but the ad data says otherwise. Pulling the last 30 form fills shows the real pattern: leads that arrive after 5 p.m. wait until the next morning for a call, and by then many have booked with someone else. The fix is an evening callback rule, not a new campaign.
When the leak is on the page itself, a form that asks too much or a booking flow that takes five clicks, that is a conversion rate optimization for plastic surgery practices job, and it usually pays back faster than buying more traffic. The common causes of a plastic surgery website that isn't converting are worth ruling out before you blame the media plan.
The Attribution Gaps in Standard Analytics
Four structural problems with how most plastic surgery practices currently see their marketing performance.
Last-click attribution destroys the SEO and content picture.
A patient researching rhinoplasty for three weeks visits the practice's site eleven times via organic search, then clicks a Google paid ad on the eleventh visit. A last-click report attributes the consult entirely to paid. The marketing dashboard shows "paid is producing all our consults," and the SEO budget gets cut. Six months later, the brand searches that paid was capturing have declined, and total consults are down across all channels, because the SEO that was actually producing the demand has been starved. In our facelift SEO case study, one procedure content cluster came to carry 45% of the practice's organic traffic, which is exactly the kind of research-stage demand a last-click view hands to paid.
Form fills count, but the unconverted form fills are invisible.
A practice gets 80 form fills a month, with 30 converting to consults and 50 evaporating. The platforms report "80 leads," and the practice and agency both feel good. The 50 lost leads represent a conversion problem (intake handling, follow-up, booking friction) that no one is looking at, because the marketing dashboard doesn't show them. That intake-and-nurture layer is exactly what our guide to lead generation for plastic surgery practices is built around.
Phone calls are tracked as a channel, not as an outcome.
Call tracking platforms count calls. They rarely close the loop to whether the call produced a consult. The practice ends up paying for "call volume" as if every call were equivalent, when in fact 30 to 50% of calls are wrong number, sales calls, current patients with billing questions, or research calls that never book.
Ad platforms optimize toward whatever you call a conversion.
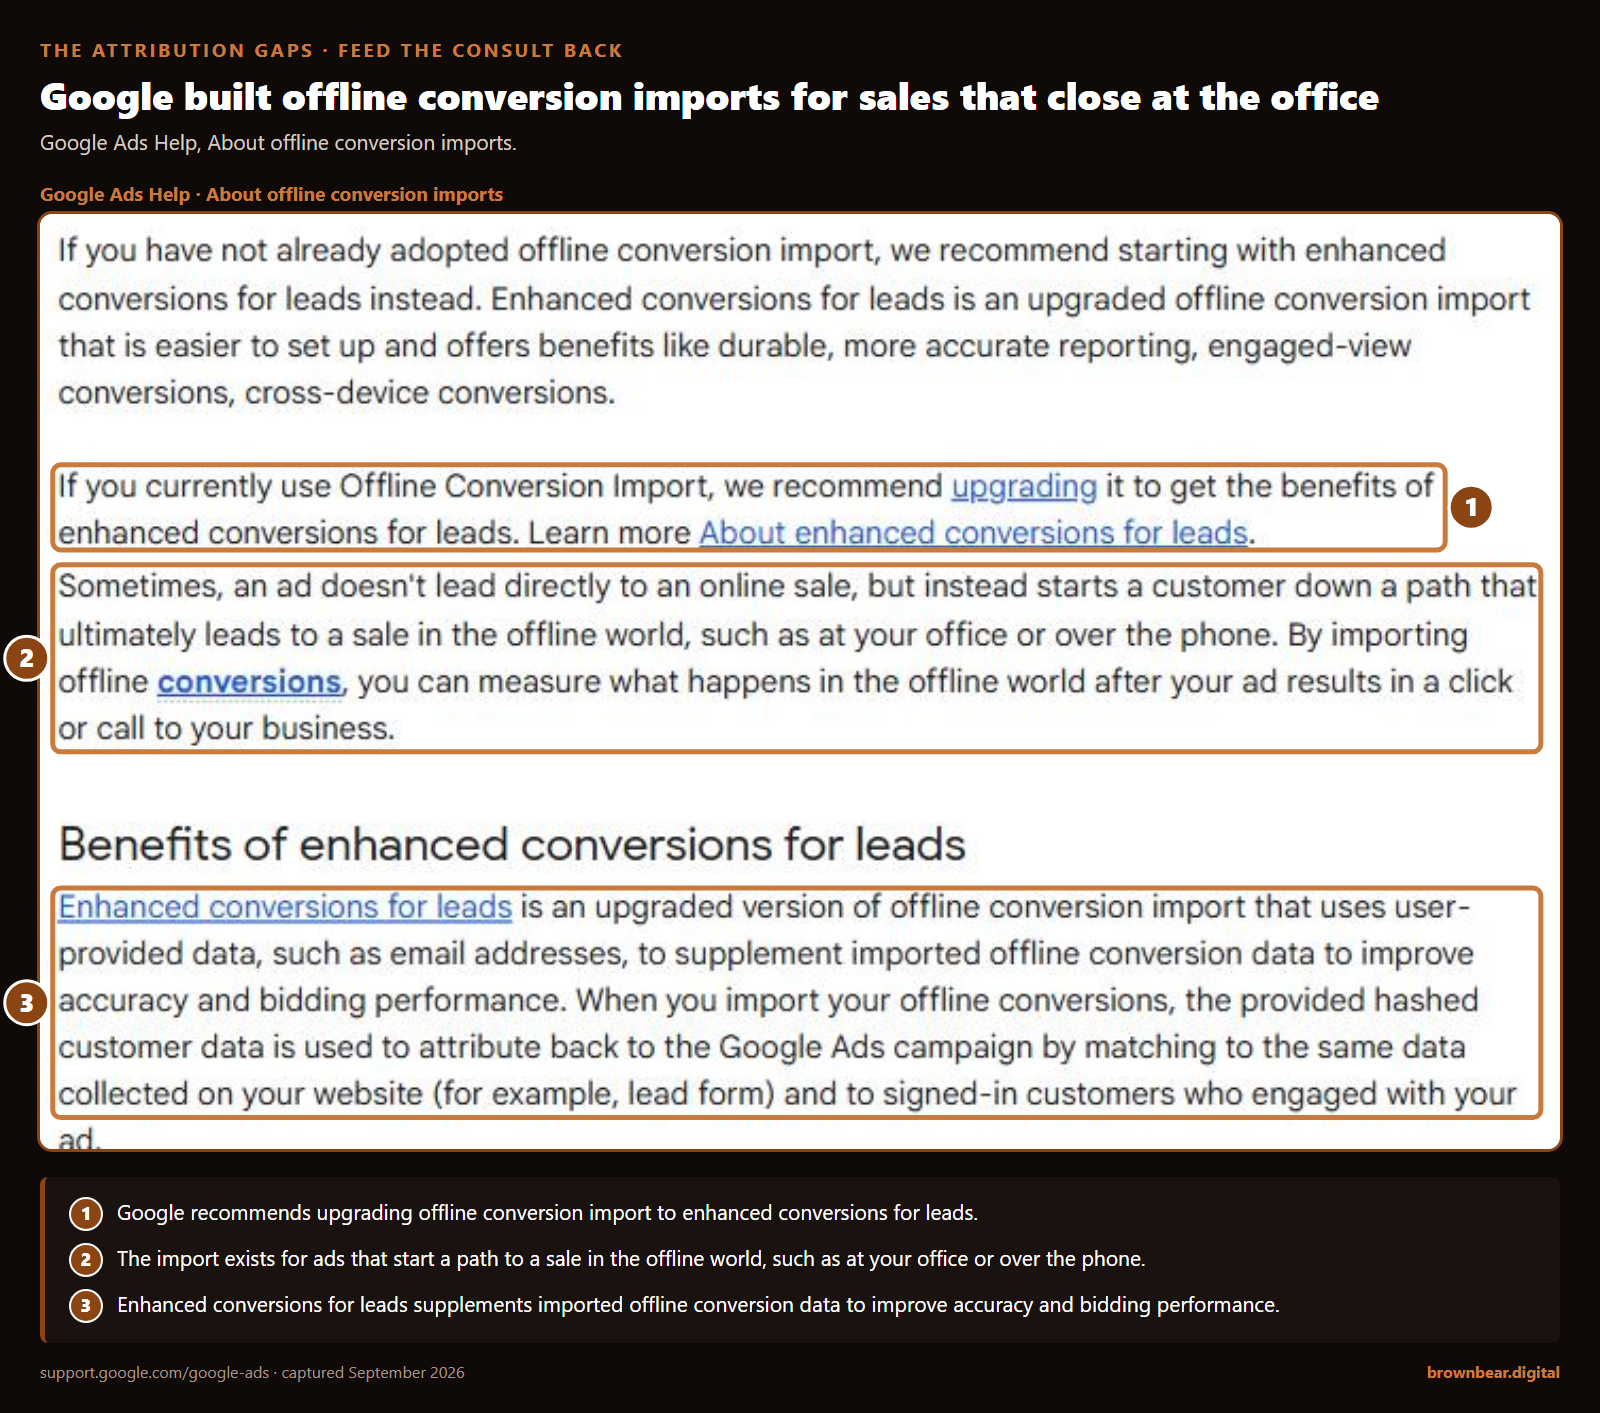
If Google Ads only ever sees "form submitted," its bidding learns to buy more form submissions, junk included. Paid-search practitioners say the same about Meta instant forms: easy to fill, rarely booked. Google built offline conversion imports for this problem, and now recommends upgrading them to enhanced conversions for leads: the booked or attended consult recorded in your CRM is sent back to the ad account, so bidding optimizes toward patients rather than forms. A practice that skips this step is paying the algorithm to find more of the wrong people.
The fix in all four cases starts the same way: source-of-consult capture at the consult itself, not inferred from analytics, and in the last case, that same record sent back to the ad platforms.
What a Real Plastic Surgery Marketing Dashboard Should Include
Built right, the practice's marketing dashboard fits on one page and updates monthly:
| Metric | Calculation | Last Month | 12-Month Avg | Trend |
|---|---|---|---|---|
| Total marketing spend | All-in (media + fees + salaries) | |||
| Consults attended | Actual attendance | |||
| Cost per consult | Spend / consults | |||
| Surgeries scheduled | From EHR/CRM | |||
| Consult-to-surgery rate | Surgeries / consults | |||
| Cost per surgery | Spend / surgeries | |||
| Average procedure revenue | From P&L | |||
| Marketing ROI | Procedure rev / spend | |||
| Source-of-consult mix | % from each channel |
That's the dashboard. Nine rows. No vanity metrics. The practice that runs this monthly and acts on it, increasing spend on channels that produce, fixing intake when consult-to-surgery drops, and killing channels with a bad cost per surgery, is making decisions on the data that actually drives the P&L.
If your EHR or CRM does not talk to your marketing data,
start with a spreadsheet. The front desk logs each attended consult with its intake answer and its outcome, and someone reconciles that log against spend once a month. It is manual, and it is still more accurate than any platform report. If you run a multi-surgeon practice with a CRM, build the same nine rows per surgeon and per procedure, because a blended consult-to-surgery rate can hide one surgeon converting at 55% and another at 25%.
One prerequisite before any of it: own the accounts.
The ad accounts, analytics property, call tracking, and landing pages should sit in the practice's name, with the agency added as a user. When the agency owns them, the history leaves when the agency does, and the dashboard starts again from zero.
To fill the first column, run last month's numbers through the calculator below.
The practice that is still receiving 40-page reports about traffic, rankings, impressions, and CTR is being managed by the agency, not the other way around.
The Operational KPIs That Belong on a Separate Report
Practice-management software vendors publish long KPI lists that mix marketing with operations: revenue per surgeon hour, operating room utilization, revenue per employee, patient retention and rebooking. Those numbers matter, but they answer a different question, whether the practice can deliver on the demand it already has, and they belong on the operations report the practice manager owns, not on the marketing dashboard.
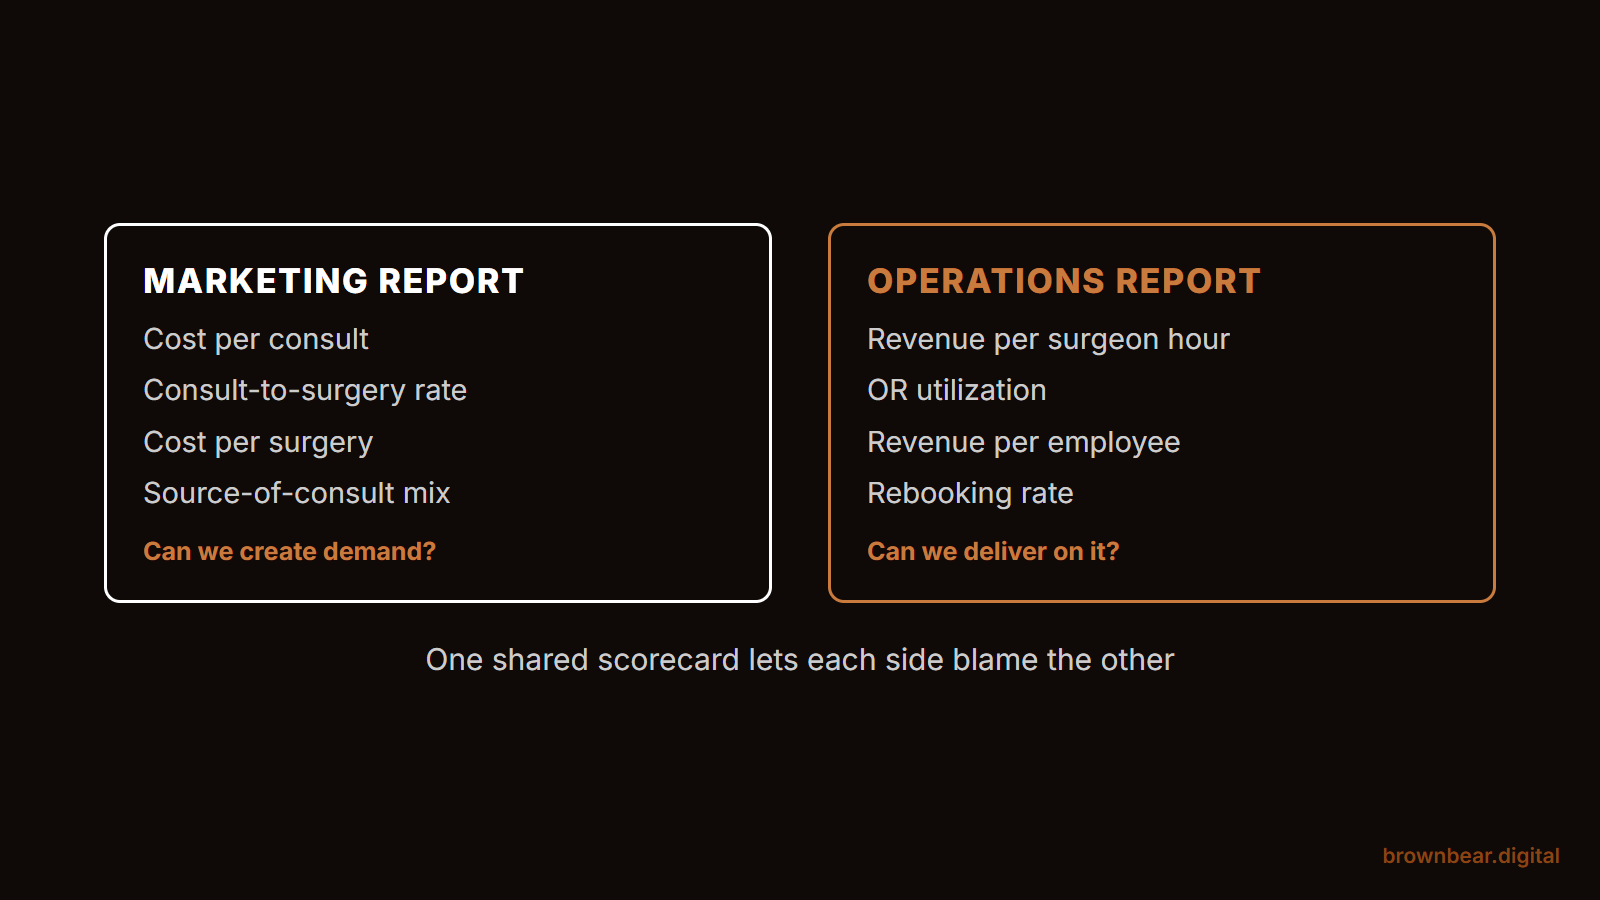
Keep the two reports apart for one reason: a blended scorecard lets each side blame the other. When marketing and operations share one page, a full schedule reads as a marketing win and a thin one reads as a marketing loss, even when the real constraint is the calendar.
If consult-to-surgery is healthy and surgeries are still flat,
look at capacity before you look at marketing: surgeon hours, OR block time, and how far out the next open surgery date sits. If surgeries are flat because consults are flat, the problem is upstream, and the five marketing KPIs above are where to look.
Say a solo facial plastic surgeon converts 45% of consults, comfortably inside the typical range, but the next open surgery date is 11 weeks out. Some of those patients book with a practice that can operate next month. More ad spend makes that worse, because it adds consults to a calendar that cannot absorb them. The fix is a second OR day or a longer surgical block, and the KPI that shows it lives on the operations report.
A Frequent Counter-Argument, Addressed
Some agencies argue that the metrics above are "too far down the funnel" for them to be responsible for, arguing that consult-to-surgery conversion is a sales/intake/surgeon problem, not a marketing problem.
This is partially true and mostly wrong.
True: the surgeon's chair-side manner, the pricing strategy, and the intake team's responsiveness all affect consult-to-surgery. Marketing can't perform a consultation.
Mostly wrong: the consult quality is heavily determined upstream by what the marketing is targeting. Paid campaigns optimized for cheap leads bring in unqualified consults. SEO content that emphasizes pricing brings in price-shoppers. Display campaigns to broad audiences bring in research-only patients who weren't going to convert at the consult anyway. The marketing is producing the consult quality.
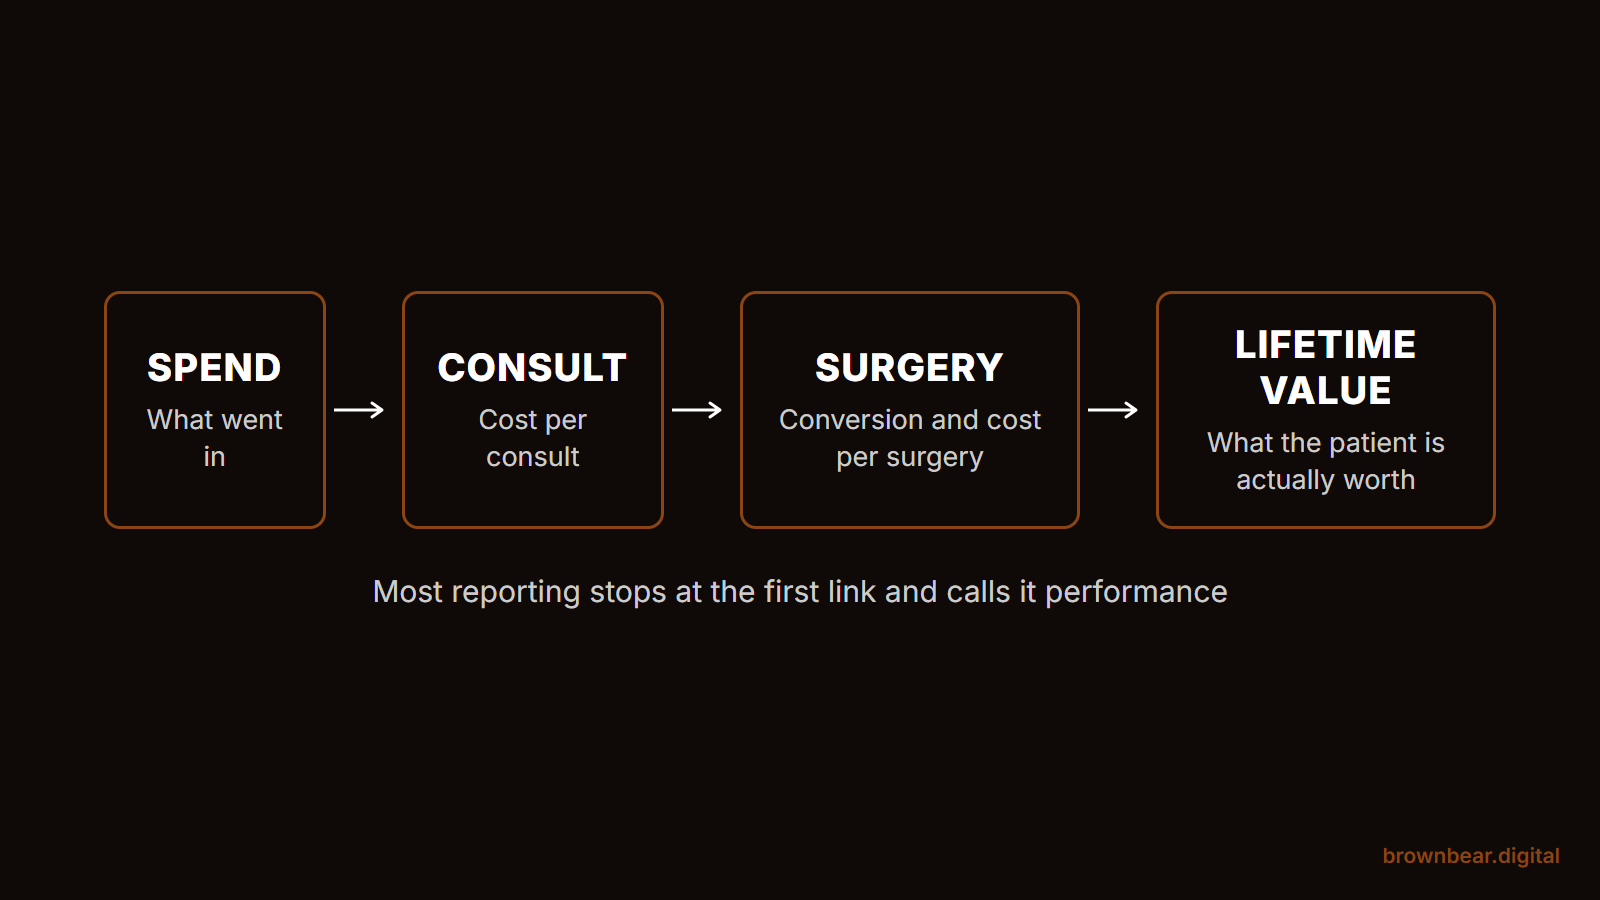
An agency that isn't measuring consult-to-surgery is not held accountable for consult quality. The accountable agency reports the full chain, spend through surgery, and tunes the front end based on the back-end performance.
What to Do Next
- Pull twelve months of data and compute the five KPIs above. Most practices have not done this; the numbers will surprise.
- Implement source-of-consult capture at intake. "How did you first hear about us?" and "What made you book today?" Two questions. Routed to the CRM.
- Demand the dashboard from your marketing partner, and confirm the practice owns the accounts behind it. If they can't produce it, the engagement is reporting on activity, not outcome. The questions in our guide to vetting a plastic surgery marketing agency surface that gap before you sign.
- Make one decision per quarter based on the data. Increase spend on the channel with the lowest cost per surgery, fix the intake step that's losing form fills, kill the procedure focus that has the worst consult-to-surgery rate.
The practice that runs on the right KPIs grows from a position of clarity. It knows what's working, knows what isn't, and reallocates capital accordingly. The practice that runs on rankings and traffic is making investment decisions in a fog. Same dollar of marketing spend, radically different outcome, because the measurement determines what gets optimized.
References
-
Brown Bear Digital. (2025). Plastic surgery marketing KPI benchmarks across client accounts, 2021 to 2025. Internal research.
-
Google LLC. (2026). Get started with attribution. Google Analytics Help. https://support.google.com/analytics/answer/10596866
-
Khosla, A. S., Zeitouni, F., Laning, E. K., Tierney, M., Attaluri, P. K., & Rao, V. K. (2026). Marketing a plastic surgery practice: Strategies, insights, and practical considerations. Plastic and Reconstructive Surgery Global Open, 14(9), e8037. https://pmc.ncbi.nlm.nih.gov/articles/PMC13542058/
-
Google LLC. (2026). About offline conversion imports. Google Ads Help. https://support.google.com/google-ads/answer/2998031
Related reading: Plastic Surgery Marketing Strategies in 2026 · Plastic Surgery SEO Services: A Buyer's Guide · Plastic Surgery PPC: Why Most Campaigns Waste Budget on the Wrong Keywords
Work with Brown Bear on Plastic Surgery Marketing That Reports the Full Chain
Most agencies send a rankings report and call it performance. Brown Bear Digital is built around a different standard: we track cost per consult, consult-to-surgery rate, and cost per acquired surgery, because those are the numbers that actually connect to your P&L. If this piece described your current reporting, that's the gap we fix. Our plastic surgery SEO services, paid search, and broader plastic surgery marketing work run the full stack, and we hold ourselves accountable to the KPIs that matter. Reach out for a conversation about what accountable plastic surgery marketing looks like in practice.
Written By
Founder, Brown Bear Digital
Bryan has 15 years of experience across SEO, paid search, and AI search strategy. He founded Brown Bear to give businesses direct access to senior-level search expertise without the agency overhead.
Learn More About BryanGet Found on Google.
Get Cited by AI.
Tell us about your site. We'll send back a proposal for SEO and AI search.