Why Plastic Surgery Websites Are Slow: 150 Top-Ranking Homepages, Timed Three Ways
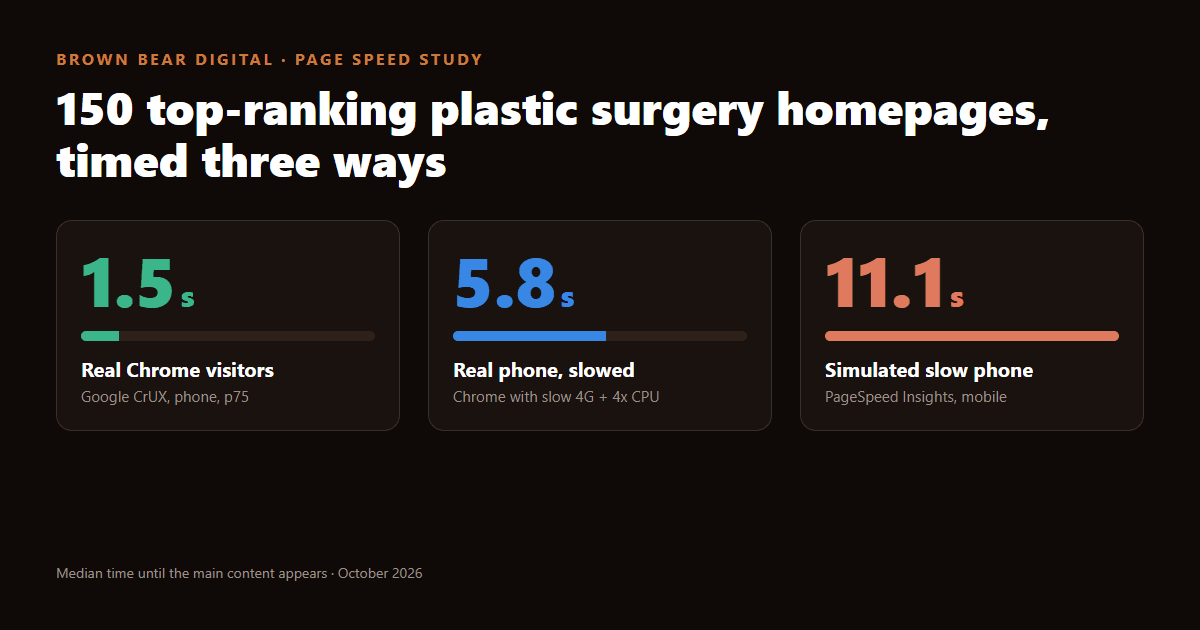
Ask three tools how fast a plastic surgery homepage is and you can get three answers that seem to contradict each other. Google Search Console says the site passes Core Web Vitals. PageSpeed Insights gives it a 52 and says the main image takes 11 seconds. The surgeon opens it on an iPhone over office Wi-Fi and it feels fine. All three can be right at once, because they are timing different visits.
So we timed the sites that are winning, three ways. We took the same 150 homepages from our JavaScript study of top-ranking practices, the top 5 private practices for "plastic surgeon in [city]" across 30 US cities, and measured each one with Google's real-visitor data from Chrome, with three runs of Google's simulated mid-range phone in PageSpeed Insights, and with a real Chrome browser slowed down to the same phone and network profile. Then we broke down where the time goes on every homepage: the server, the download, the scripts, the marketing tags, and the moment the headline actually appears.
If your developer has told you the site is fast and your agency has told you it is slow, this is the referee. If your homepage already ranks #1, it shows what a new patient on an ordinary phone waits through before they see your name. And if you build or market these sites, it is a benchmark with names attached: what the fastest homepages in the study do differently, and what the slow ones are actually spending their time on.
When we looked at the numbers, we found that these homepages download fast enough and then hold their content back. The server usually answers quickly, the hero image arrives quickly, and then the page waits for scripts, animations and marketing tags before it shows the headline. That meant the fix for most practices is not a new host or a new site. It is deciding what the homepage is allowed to load before a patient can see it. We cover why speed matters for SEO and for leads, the three clocks, the five places the time goes, the platform split, what did not matter, the fastest homepages and a checklist for reading your own report.
Key Takeaways
59 of 73 homepages pass Core Web Vitals for real visitors
Google's real-visitor data says 81% of the sites with all three metrics pass, and the median real visitor sees the main content in 1.5 seconds. Real-visitor data only exists for 100 of the 150 homepages.
11.1 seconds on Google's simulated slow phone
The same homepages take a median 11.1 seconds to show their main content in PageSpeed Insights' mobile test, and only 2 of 150 get under Google's 2.5-second line. A real Chrome browser slowed to the same profile measured a median 5.8 seconds.
The hero is ready, then held back for 1.5 seconds
Even on Google's fast test machine, the median homepage waited 1.5 seconds after its main content had downloaded before showing it. On 102 of 149 homepages that wait is more than half the total.
A third of the work is marketing tags
Third-party code takes a median 33% of each homepage's processing time. Google Tag Manager alone is on 134 of 149 homepages at a median 346 KB.
Each extra megabyte of JavaScript costs seconds
Homepages under 500 KB of JavaScript showed their main content in a median 6.8 seconds in the simulated test. Homepages over 2 MB took 17.3 seconds.
Why Page Speed Matters for SEO
The short answer: page speed is a confirmed but small Google ranking signal, it is measured on real Chrome visitors on phones rather than on your PageSpeed score, and its biggest search payoff is the patient who stays long enough to book.
Speed questions usually arrive as SEO questions, so here is how the two connect, and where this study's numbers fit.
- Core Web Vitals are a ranking input, and a small one. Google states plainly that "Core Web Vitals are used by our ranking systems." The same page says Google "always seeks to show the most relevant content, even if the page experience is sub-par," and that there is no single page experience signal. Speed decides close calls between relevant pages. It does not lift an irrelevant page over a relevant one, which is exactly what our ranking data shows further down.
- Google grades the real-visitor clock, not the PageSpeed score. The Core Web Vitals report in Search Console is built from the Chrome UX Report, the real-visitor data this study calls the first clock. A 38 in red on PageSpeed Insights is a lab diagnosis, not the number Google reports back to you. That is why 59 of the 73 homepages with full data pass in Google's eyes while almost none pass the simulated test.
- No traffic, no grade. Fifty of the 150 homepages have too little Chrome traffic for Google to report Core Web Vitals at all, at page or site level. For those practices the simulated test is the only speed view anyone has, including the developer quoting for a rebuild.
- Google indexes and ranks the phone version. Google uses "the mobile version of a site's content, crawled with the smartphone agent, for indexing and ranking." Phones are where every clock in this study is slowest, so the phone homepage is the one to fix first.
- Slow servers get crawled less. Google's crawl guidance says that when response times get longer, "the limit goes down and Google crawls less." A 40-page practice site rarely runs into that limit, but the server step is also where real visitors wait: only 39 of 83 measured homepages answer within Google's 800-millisecond line.
- The held-back hero is an AI search problem too. A headline that waits for a script to appear is also a headline that never reaches the AI crawlers that do not run JavaScript. The fix for the speed problem and the fix for the visibility problem are the same change.
The search payoff that is easiest to miss is the one after the click. Ranking #1 buys the visit, and a homepage that holds its content back for seconds on a mid-range phone spends it. The rest of this study is about where those seconds go.
How a Faster Homepage Wins More Leads
The short answer: the published studies that measured both speed and conversions found that faster pages win more inquiries, and lead generation sites show some of the steepest gains.
This study timed homepages, not consultation requests, so the conversion evidence comes from studies that measured both. They point the same way.
- Lead generation sites convert several times better when they load fast. Portent's 2022 study of 20 sites, 14 of them B2B lead generation sites, found that a site loading in 1 second had a conversion rate 3 times higher than a site loading in 5 seconds, and 5 times higher than one loading in 10.
- A tenth of a second is measurable. In a 2020 Deloitte study commissioned by Google, a 0.1-second improvement in mobile site speed improved bounce rate on lead generation information pages by 8.3%, and lifted retail conversions by 8.4% and travel conversions by 10.1%.
- Main content speed is the metric that moves the number. Renault's analysis, published by Google's web.dev team, found that a 1-second improvement in the time to show the main content went with a 14-point drop in bounce rate and 13% more conversions. That is the same main-content measure this study timed on all 150 homepages.
For a practice, a conversion is a consultation request, a call or a booked appointment. The homepages in this study are already paying for the visit through rankings, ads and social. The 51 homepages that pass Google's line for real visitors but take more than 4 seconds on a slowed phone are the clearest opportunity, because the patients most likely to give up on them are the new ones the practice paid to reach. Every second the homepage gives back is a second those patients spend reading about the surgeon instead of watching a blank screen.
How We Timed 150 Homepages: Three Clocks and a 100-Point Rubric
The short answer: every homepage was timed with Google's real-visitor data, with three runs of Google's simulated mid-range phone, and once in a real Chrome browser slowed to the same profile, then broken down step by step.
The 150 homepages are the sample from our JavaScript study, chosen from the live Google results for "plastic surgeon in [city]" on October 11, 2026: the top 5 private-practice domains in each of 30 cities, with directories, publishers and hospital systems set aside. Each homepage was then timed three ways, which we call the three clocks:
- Real visitors. Google's Chrome User Experience Report (CrUX), the same data behind the Core Web Vitals report in Search Console. It covers real Chrome visits on phones over the 28 days ending October 9, 2026, read at the 75th percentile.
- Google's simulated slow phone. PageSpeed Insights on mobile, which runs Lighthouse 13.5 and simulates a mid-range phone on a slow 4G connection. We ran it three times per homepage on October 12 and kept the median.
- A real slowed phone. The same homepage loaded once in a real Chrome browser with the same network and processor slowdown applied for real rather than simulated, with an empty cache.
We also pulled the diagnostic detail from each test: what the main content element was, how long each step took, which third-party tools ran and what they cost. The 100-point rubric weights real-visitor experience at 40 points, the simulated phone test at 25, server and delivery at 10, page weight at 15, and the hero and media at 10. Because no homepage gets near Google's absolute line in the simulated test, those tiers compare the 150 sites with each other, and the absolute pass rates are reported on their own.
Fast for Real Visitors, Slow on a Mid-Range Phone
The short answer: the median real visitor sees the main content in 1.5 seconds, Google's simulated slow phone takes 11.1 seconds, and a real browser slowed to the same profile lands in between at 5.8 seconds.
By Google's real-visitor data, these homepages are in good shape. Of the 73 with enough traffic for all three Core Web Vitals, 59 pass (81%). Main content appears within Google's 2.5-second line on 85 of 95 measured homepages, every one of the 73 with response data responds to taps within 200 milliseconds, and 95 of 100 hold still while loading. The simulated test disagrees completely: only 2 of 150 homepages show their main content within 2.5 seconds, and 85 take longer than 10.
Three things explain the gap, and the first one matters most for plastic surgery.
- The real-visitor data leaves people out. CrUX collects only from Chrome on desktop and Android. Chrome on an iPhone is not in it, and neither is Safari, so a practice whose patients mostly browse on iPhones is graded on the minority who do not. Fifty of the 150 homepages have too little Chrome traffic to appear at all.
- The visitors who are counted have it easy. Many are on recent phones and fast connections, and some are returning visitors whose browser already holds the scripts and images. The simulated test is a first visit, on a mid-range phone, over a slow connection, which is what a new patient arriving from Instagram or a paid ad looks like.
- The simulation is harsher than a real slowed phone. Lighthouse does not slow the page down while it loads. It loads the page quickly on Google's servers, then estimates how long a slow phone would take from that fast run. On heavy pages that estimate runs long: the real slowed browser measured a median 5.8 seconds, and 89 of 150 homepages still took more than 4 seconds.
The real slowed phone is the fairest of the three, and it still finds the gap. Of the 85 homepages that pass Google's line for real visitors, 51 took more than 4 seconds to show their main content on the slowed phone, and only 31 of all 150 homepages got under 2.5 seconds.
The useful conclusion sits between the clocks. Passing in Search Console means the patients Google can see are mostly fine. It does not mean a first-time visitor on an ordinary phone is fine, and the PageSpeed number, while inflated, ranks the sites in the right order.
Picture a marketing lead at a three-surgeon practice who checks Search Console every month and sees green. The agency sends a PageSpeed screenshot with a 38 in red and a proposal to rebuild. Both are telling the truth. The question that settles it is which visitors the practice is paying to bring in. If most consultations start from paid social on phones, the first-visit clock is the one that matters.
The Hero Is Ready, Then Held Back
The short answer: on Google's fast test machine, the median homepage waited 1.5 seconds after its main content had already downloaded before showing it, and on 102 of 149 homepages that wait was more than half the load.
This is the single biggest finding in the study, and it is the one no generic speed checklist covers. Lighthouse splits the time to show the main content into four steps. On the median homepage, measured on Google's own unthrottled machine, the server answered in 27 milliseconds, the browser waited 365 milliseconds to start fetching the hero, the download took 105 milliseconds, and then the page held the finished content back for 1,543 milliseconds. The slow step is not the network. It is the page.
What holds it back is the pattern our JavaScript study photographed: headlines and hero sections set to invisible and faded in by an animation script, sliders that wait for their library before showing the first slide, and pages that will not paint until every stylesheet and font has arrived. Homepages whose main content is text showed the longest wait, a median 2.0 seconds, which is backwards. Text should be the fastest thing on the page. On those sites it is waiting for a script to give it permission to appear.
The worst cases make the point. The main content on phxplasticsurgeryaz.com waited 5.7 seconds after it was ready, capizzimd.com 5.5 seconds and somenekpittmanmd.com 4.4 seconds, on a fast machine. Slow the processor down to a mid-range phone and those waits multiply.
Picture a patient on a three-year-old Android phone who taps a practice's Instagram ad between appointments. The hero photo finishes downloading in a fraction of a second. For the next several seconds the screen shows a logo and a white space where the headline should be, because the headline is waiting for an animation script that is still loading behind four marketing tags. The practice paid for the click. The page made the patient wait for a fade-in.
What Every Marketing Tag Costs
The short answer: third-party code takes a median 33% of each homepage's processing time, and Google Tag Manager, Google's reCAPTCHA libraries, the Facebook pixel and YouTube embeds cost the most.
| Tool | Homepages | Median download | Median processing time |
|---|---|---|---|
| Google Tag Manager | 134 of 149 | 346 KB | 377 ms |
| reCAPTCHA and other Google-hosted libraries | 62 | 359 KB | 215 ms |
| Facebook / Meta pixel | 43 | 156 KB | 251 ms |
| YouTube video embed | 18 | 995 KB | 764 ms |
| accessiBe accessibility overlay | 16 | 242 KB | 208 ms |
| Google Maps embed | 10 | 468 KB | 253 ms |
| UserWay accessibility widget | 61 | 74 KB | 38 ms |
Processing times are from Google's fast test machine, so a mid-range phone takes several times longer. None of these tools is wrong to have. The problem is that most homepages load all of them before the patient has seen anything, for features most visitors never touch. reCAPTCHA protects a form most homepage visitors never open. A YouTube embed loads about a megabyte of player for a video that plays only if someone presses play. Tag Manager containers collect pixels from every campaign the practice has ever run, and nobody removes the old ones.
The most expensive homepage in the study for third-party code, drbucky.com in Philadelphia, spent 4.5 seconds of processing on third-party tools, 3.4 of it on YouTube. The median homepage also loads 416 KB of JavaScript it never runs while the page loads, and 67 homepages load more than 500 KB of it. Most of that unused code belongs to Tag Manager, reCAPTCHA and YouTube.
Tick the tools your homepage loads. Each number is the median cost we measured on the top-ranking plastic surgery homepages that carry that tool.
Medians from a study of 149 homepages, captured October 12, 2026; your site's real cost depends on how each tool is configured. For information only, not a guarantee of results. Your answers stay in this browser only; nothing is sent anywhere.
Say a practice runs Tag Manager, the Meta pixel, reCAPTCHA on the contact form, a YouTube tour of the office and a chat bubble. At the study medians that is roughly 2 MB and about 1.7 seconds of processing on a fast machine before the hero has priority. None of it is visible above the fold. Moving the video to a click-to-play poster, firing pixels after the page loads and loading reCAPTCHA only on the form page keeps every feature and gives the first screen back to the patient.
JavaScript Weight Is the Clearest Predictor
The short answer: the more JavaScript a homepage loads, the longer it takes in every test, from a median 6.8 seconds under 500 KB to 17.3 seconds over 2 MB in the simulated phone test.
| JavaScript on the homepage | Homepages | Median main content, simulated phone | Median time frozen by scripts |
|---|---|---|---|
| Under 500 KB | 27 | 6.8 s | 104 ms |
| 500 KB to 1 MB | 45 | 9.7 s | 302 ms |
| 1 to 2 MB | 51 | 14.3 s | 602 ms |
| Over 2 MB | 27 | 17.3 s | 1,318 ms |
The median homepage loads 1,078 KB of JavaScript on mobile, and the curve never flattens. The real slowed phone shows the same climb at a gentler slope: a median 3.6 seconds under 500 KB, 6.4 and 6.7 seconds in the middle two groups, and 8.6 seconds over 2 MB. The real-visitor pass rate falls with it too, from 8 of 9 homepages under 500 KB to 9 of 13 over 2 MB, though fewer of the light sites have enough traffic to measure. The two studies line up: homepages that earned an A in our JavaScript study took a median 7.2 seconds in the simulated test, and the D grades took 18.0 seconds. A page that hides its hero behind scripts is also a page that loads a lot of them.
Images, Fonts and the Hero Nobody Marks as a Priority
The short answer: 92 of the 117 homepages whose main content is an image never tell the browser that image comes first, and better image formats and sizing would save a median 221 KB per homepage.
Browsers fetch images in the order they discover them, with no idea which one matters. One attribute, fetchpriority="high" on the hero image, tells the browser to fetch it first. Only 25 of the 117 image-led homepages use it. Another 31 load the hero image from a stylesheet or a script, so the browser cannot even see it until those files arrive, and 4 mark the hero image to load lazily, which tells the browser to delay the most important image on the page. Google's own guidance is never to lazy-load it.
Image weight is a smaller problem than the checklists suggest, but it is real. The median homepage could save 221 KB with modern formats and correct sizing, 23 homepages could save more than 1 MB, and 33 homepages download more than 10 MB in total. Fonts are the quieter cost: a median 223 KB, and 87 homepages load more than 200 KB of fonts before the text can settle.
Where Hosting Does Matter
The short answer: the server is rarely what makes these homepages slow in the lab, but for real visitors only 39 of 83 measured homepages answer within Google's 800-millisecond line.
This is where the usual advice is half right. On Google's test machine the median server answered in 27 milliseconds, so hosting is not why the simulated phone takes 11 seconds. Real visitors see something different: the median homepage's first response takes 842 milliseconds at the 75th percentile, just over the line, and 44 of the 83 homepages with data are slower than it. That gap points at the distance between the server and the visitor, uncached pages and redirect chains more than raw server power. A content delivery network and full-page caching help here. Upgrading to a bigger server rarely does.
If your developer's first suggestion is a new host, ask to see the four-step breakdown in your own PageSpeed report first. If the first step is long, hosting is the conversation. If the last step is long, the host is not the problem.
Why Your Website Is Slow Depends on How It Was Built: WordPress and Custom Sites
The short answer: custom-built homepages showed their main content in a median 8.2 seconds in the simulated test, WordPress homepages in 12.9 seconds and WordPress homepages built with Elementor in 13.4 seconds.
The platform is not destiny, but it sets the starting weight, and the fix differs.
For WordPress sites
WordPress runs 82 of the 150 homepages, and page builders add their own layer. Among homepages with real-visitor data, the Elementor builds took a median 18.4 seconds in the simulated test and only 6 of 12 passed Core Web Vitals, against 19 of 23 for other WordPress sites. The fastest WordPress homepages in the study avoid the builder's animation and slider modules on the first screen, cache full pages and load marketing tags after the page. On a WordPress site, the first move is an audit of plugins and builder widgets that load on the homepage, because each one usually brings its own scripts and styles.
For custom-built sites
Custom builds are the fastest group, with a median simulated time of 8.2 seconds, and among those with real-visitor data 19 of 20 pass Core Web Vitals. The 13 homepages credited to Studio 3 Marketing, the agency that ranked #1 for "plastic surgery website design" when we checked on October 11, posted a median 7.7 seconds and a median rubric score of 76, the best of any agency with more than a few sites. A custom build is not automatically fast, though. Instituteplasticsurgery.com, ranked #2 in Columbus, took 56 seconds in the simulated test with 17 MB of total downloads. On a custom site, the first move is a weight budget written into the contract: total JavaScript, total page weight and the hero image size.
What Did Not Matter: Video, Animation Libraries and Rank
The short answer: autoplay video, animation libraries and search position did not move the simulated load time in this sample.
Homepages with autoplay video took a median 10.9 seconds in the simulated test, and homepages without it took 11.1. That does not make video free. The main content on most video homepages is the poster frame or the text over it, so the test stops the clock before the video file finishes, while the patient's data plan and scrolling still pay for it. Animation libraries showed the same non-result on load time, because the cost they add shows up in the held-back hero rather than the download.
Position did not track speed either. The 27 homepages ranked #1 took a median 13.0 seconds in the simulated test, slower than the 10.9 seconds of positions 2 to 8, and 16 of 19 with data passed Core Web Vitals. That is the small-signal point from the SEO section in practice: these sites win on reputation, reviews and relevance. The reason to fix it is the patient who leaves before the page appears, not the ranking.
The Fastest Homepages in the Study
The short answer: the fastest homepages load less than 500 KB of JavaScript, show a real headline immediately and keep marketing tools off the first screen.
Boston Plastic Surgery's homepage at bostonplastic.com showed its main content in a median 2.3 seconds in the simulated test and 1.8 seconds on the real slowed phone, with 431 KB of JavaScript and 748 KB in total, and topped the rubric at 93.5. Restore SD Plastic Surgery in San Diego followed at 2.6 seconds and 474 KB of JavaScript, and Dr. Orlando Llorente's homepage in Miami posted the fastest simulated time at 2.1 seconds and showed its main content in 1.0 second on the real slowed phone. Donaldson Plastic Surgery in Columbus, Nashville Plastic Surgery Institute, Marina Plastic Surgery in Los Angeles and Dr. Paul Nassif in Beverly Hills round out the top scores. None of them look bare. They are ordinary premium practice sites that decided what the first screen loads.
How to Read Your Own PageSpeed Insights Report
Five checks turn any PageSpeed Insights report into a diagnosis. Run your homepage at pagespeed.web.dev on mobile and work down the list.
- Read the top section first. "Discover what your real users are experiencing" is the real-visitor clock. If it says there is not enough data, you are being judged on the simulation alone.
- Compare it with the simulated number below. If real visitors pass and the simulation fails, your returning Android visitors are fine and your first-time phone visitors are not.
- Open the main content breakdown. In the diagnostics, find the breakdown of the main content time. A long last step means scripts and animations are holding the hero back. A long first step means the server or redirects.
- List every third-party tool. Use the third parties section and the Tag Tax Calculator above. Anything a patient does not need in the first five seconds can load after the page.
- Check the hero image. It should carry
fetchpriority="high", it should not be lazy-loaded, and it should be an image tag in the HTML rather than a background set by a script.
Where you start depends on your numbers. If your homepage has no real-visitor data, fix toward the simulated test, because that is the only view anyone has. If your homepage passes for real visitors but your ads send cold traffic to it, fix the held-back hero and the tag load first. And if the server step dominates, start with caching and a CDN before anything else.
Run your homepage at pagespeed.web.dev on mobile, then copy three numbers from the report. See where you land among 150 top-ranking plastic surgery homepages and which clock you are failing.
Compares your numbers with results from a study of 150 homepages captured October 2026. For information only, not a guarantee of rankings or results. Your numbers stay in this browser only; nothing is sent anywhere.
Methodology, Limits and the Sites We Studied
Real-visitor data comes from the Chrome UX Report API, phone form factor, 28 days ending October 9, 2026, read at the 75th percentile, at page level for 29 homepages and origin level for 71. The simulated phone test is PageSpeed Insights on mobile (Lighthouse 13.5), three runs per homepage on October 12, 2026, with the median kept. The real slowed phone is one cold-cache load per homepage in Chrome via Playwright with Lighthouse's mobile network and processor profile applied through the browser's own throttling, on October 12, 2026; six homepages had not finished loading after 60 seconds and are counted at the main-content time they reached. A single run varies, and the two lab clocks agree only loosely on which individual sites are slowest, so read site-level lab numbers as ranges and the medians as the finding. The four-step breakdown, third-party costs and processing times come from an additional PageSpeed Insights run per homepage and are measured on Google's unthrottled test machine. Rubric scores for the 50 homepages without real-visitor data are scored on the remaining 60 points and reported separately. Scores are a snapshot of one week and do not measure reviews, links or any other ranking factor.
The full source list from the JavaScript study covers every search result we read and the 150 homepages studied. The speed measurements and scoring scripts are available on request, so any practice can check its own row.
Get a Page Speed Audit of Your Practice Homepage From Brown Bear
This study is the audit we run on a single practice site: all three clocks, the four-step breakdown, every third-party tool and what it costs, scored against the 150 homepages above. The result is a short list of changes ranked by how much time they give back to a first-time patient on an ordinary phone. If you want a homepage that shows a new patient your name before they give up, start with our plastic surgery web design team.
Time Your Homepage on All Three Clocks
We will time your homepage the way this study did, with real-visitor data, the simulated phone test and a real slowed phone, then break down where the time goes and score it against the 150 top-ranking practices in this report. You get the breakdown, the tag costs and a prioritized fix list.
Get Your Page Speed AuditWritten By
Founder, Brown Bear Digital
Bryan has 15 years of experience across SEO, paid search, and AI search strategy. He founded Brown Bear to give businesses direct access to senior-level search expertise without the agency overhead.
Learn More About BryanGet Found on Google.
Get Cited by AI.
Tell us about your site. We'll send back a proposal for SEO and AI search.